Fig. 3
Download original image
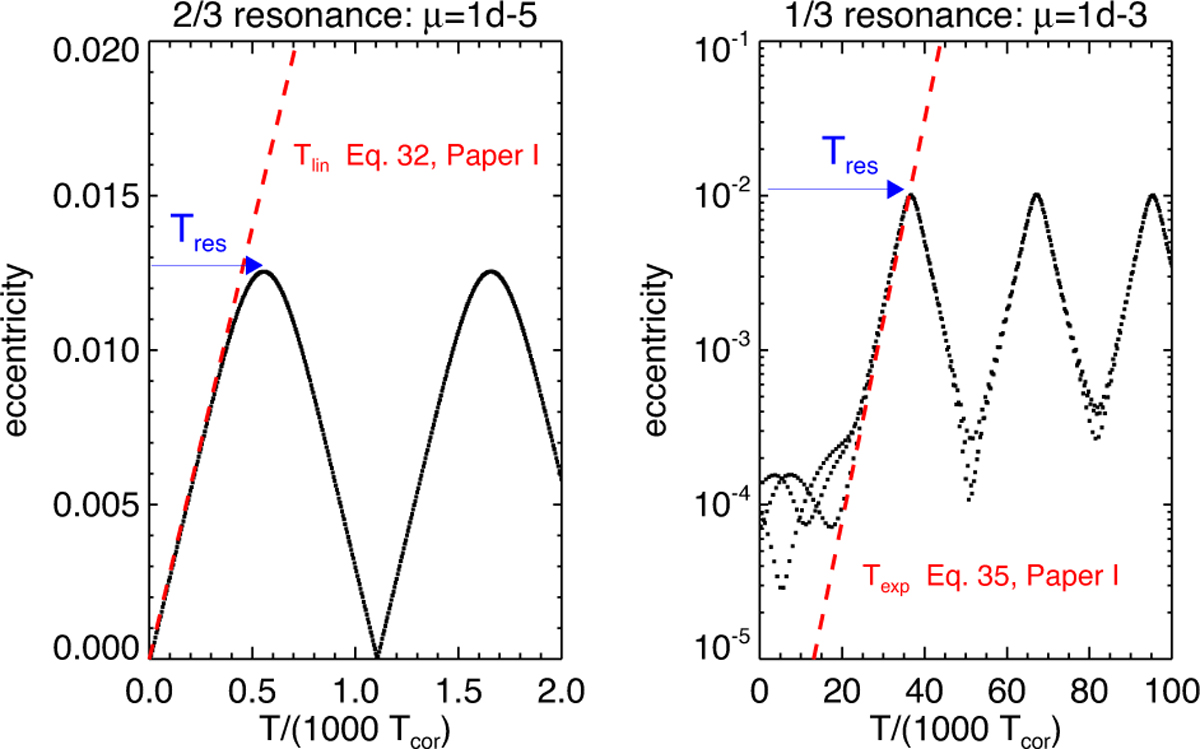
Comparison of eccentricity evolution at the first-order 2/3 and second-order 1/3 SORs. The black curves follow the evolution of test particles released near exact resonance, while the red dashed lines display the theoretical prediction, i.e., a linear growth rate for the first-order SOR and an exponential growth rate for the second-order SOR.
Current usage metrics show cumulative count of Article Views (full-text article views including HTML views, PDF and ePub downloads, according to the available data) and Abstracts Views on Vision4Press platform.
Data correspond to usage on the plateform after 2015. The current usage metrics is available 48-96 hours after online publication and is updated daily on week days.
Initial download of the metrics may take a while.