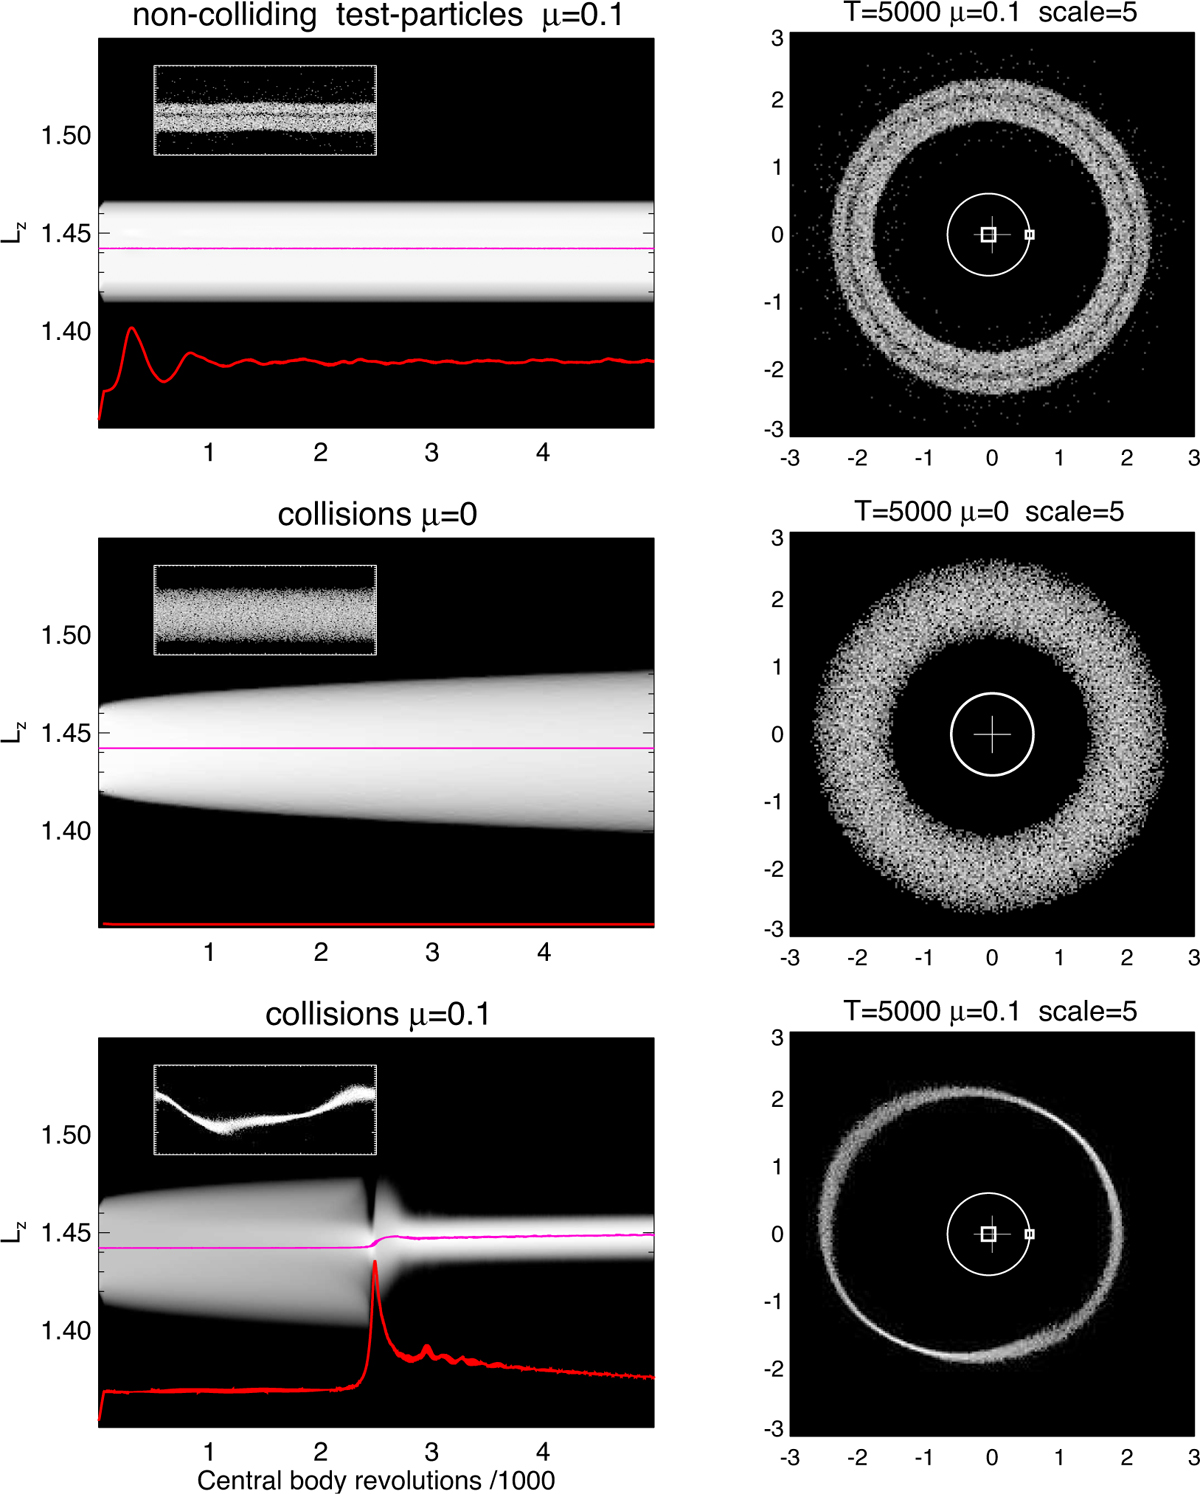
Fig. 5
Download original image
Three cases showing the combined effects of collisions and the 1/3 SOR on the ring confinement. The left frames show the time evolution of the vertical angular momentum (Lz) distribution of the particles around the 1/3 SOR at Lz = 1.44. The magenta lines are the average value of Lz and the red lines show the RMS of the particle eccentricities; the full y-range of the frame corresponds to e = 0.1. The insets are polar plots of the particle positions, shown again in the right column in cartesian coordinates. For better viewing, in the cartesian projections the width of the ring around its center position at each azimuth and the deviations of this center position from the overall mean distance have both been expanded by a factor of five. We compare three cases: (i) A ring of collisionless test particles perturbed by a µ = 0.1 mass anomaly on an otherwise spherical central body (upper row); (ii) Colliding particles around a spherical central body without perturbation (µ = 0, middle row); and (iii) A ring of colliding particles with µ = 0.1 (lower row). All simulations use the same initial conditions with 30 000 particles placed initially in an annulus r = 2.02–2.14 straddling the 1/3 SOR at semimajor axis a = 2.08. In the collisional simulations the particle radius R = 10−3 corresponds to about 200 m for Chariklo’s ring particles and yields an initial geometric optical depth τ0 = 0.06. In the case of a mass anomaly, the perturbation is turned on linearly during the first 50 revolutions of the central body.
Current usage metrics show cumulative count of Article Views (full-text article views including HTML views, PDF and ePub downloads, according to the available data) and Abstracts Views on Vision4Press platform.
Data correspond to usage on the plateform after 2015. The current usage metrics is available 48-96 hours after online publication and is updated daily on week days.
Initial download of the metrics may take a while.