Fig. 6
Download original image
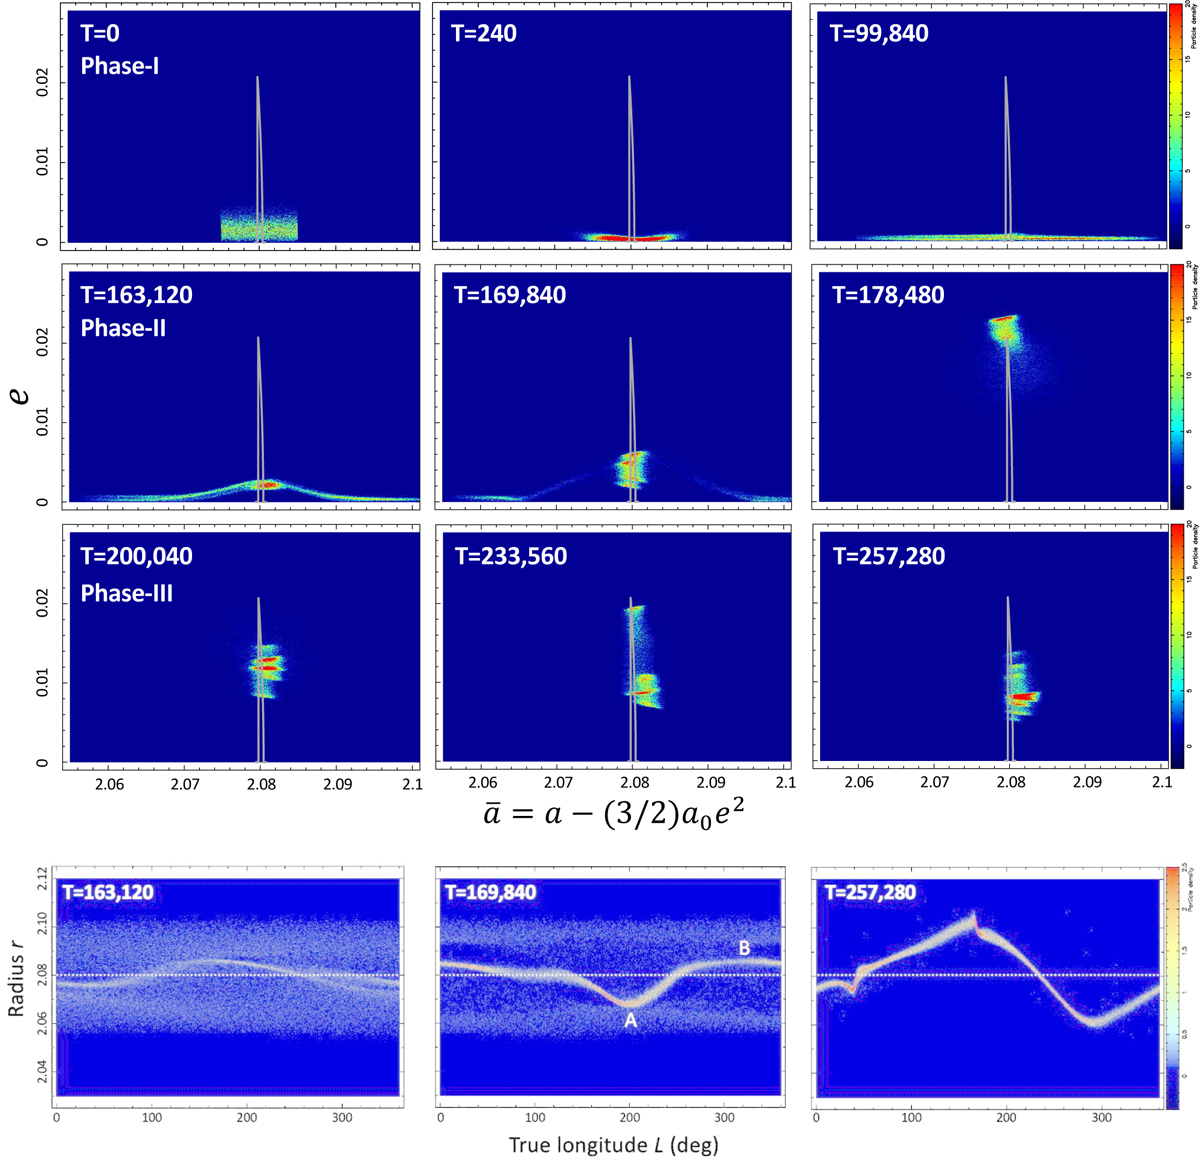
Simulation with 40 000 ring particles of radius R = 1.25 × 10⁻⁴ (corresponding to 25 m for Chariklo’s ring particles) perturbed by a mass anomaly µ = 3 × 10⁻³. The time T is given in units of Chariklo’s rotation period (about 7 h, Table 1), so that the maximum time shown here (T = 256 280) corresponds to about 206 years. Upper nine panels: density maps of the particles in the modified semimajor-eccentricity (ā, e) space (see Eq. (2)). The gray spiky curve is the value of emax shown in the lower left panel of Fig. 2. Three phases of the ring evolution are displayed. Phase I corresponds to a rapid damping of the initial eccentricities accompanied by a radial spreading caused by collisions; During Phase II, the 1/3 SOR excites the orbital eccentricities of the particles up to the predicted peak value epeak (Eq. (3)), while confining concomitantly the material near the resonance (ā ≈ 2.08) over a timescale Tres (Eq. (4)). Finally, during Phase III, the eccentricities damp due to dissipative collisions and a quasi-steady-state is reached, where the eccentricity damping is balanced by the resonance excitation. Lower three panels. Density maps of the particles in polar coordinates (L, r) space at three selected times shown in the upper panels. The white dotted lines indicate the location of the 1/3 SOR. At T = 163 120 a streamline forced by the 1/3 SOR has appeared, with a tendency of self-crossing around L = 260 deg. It is gathering material from the background unexcited particles. At T = 169 840, the accumulation process is going on, where a well-formed ringlet with various azimuthal modes collects more background material. At T = 257 280, all the ring material has been accumulated onto the ringlet, which is now dominated by a m = 1 azimuthal mode, with the presence of two kinks. The colors in the plots indicate the density of particles (in arbitrary units, density increasing from blue to red). Five movies generated from this simulation are available online.
Movie1illustrates the evolution in the (ā, e) space during Phase I, between T=0 and T=99 840 (corresponding to 0 and 79.77 years for Chariklo, respectively), using snapshots stored every 240 Chariklo rotations (about 70 days).
Movie2and
Movie3show the same for Phase II (between T=100 000 and T=199 840) and Phase III (between T=200 000 and T=257 280), respectively. The third movie also plots the position of an individual particle (white dot), showing its capture into the ring and its subsequent motion inside the cloud of points.
Movie4and
Movie5display the same snapshots in the longitude-radius space corotating with Chariklo, for Phases II and III, respectively.
Current usage metrics show cumulative count of Article Views (full-text article views including HTML views, PDF and ePub downloads, according to the available data) and Abstracts Views on Vision4Press platform.
Data correspond to usage on the plateform after 2015. The current usage metrics is available 48-96 hours after online publication and is updated daily on week days.
Initial download of the metrics may take a while.