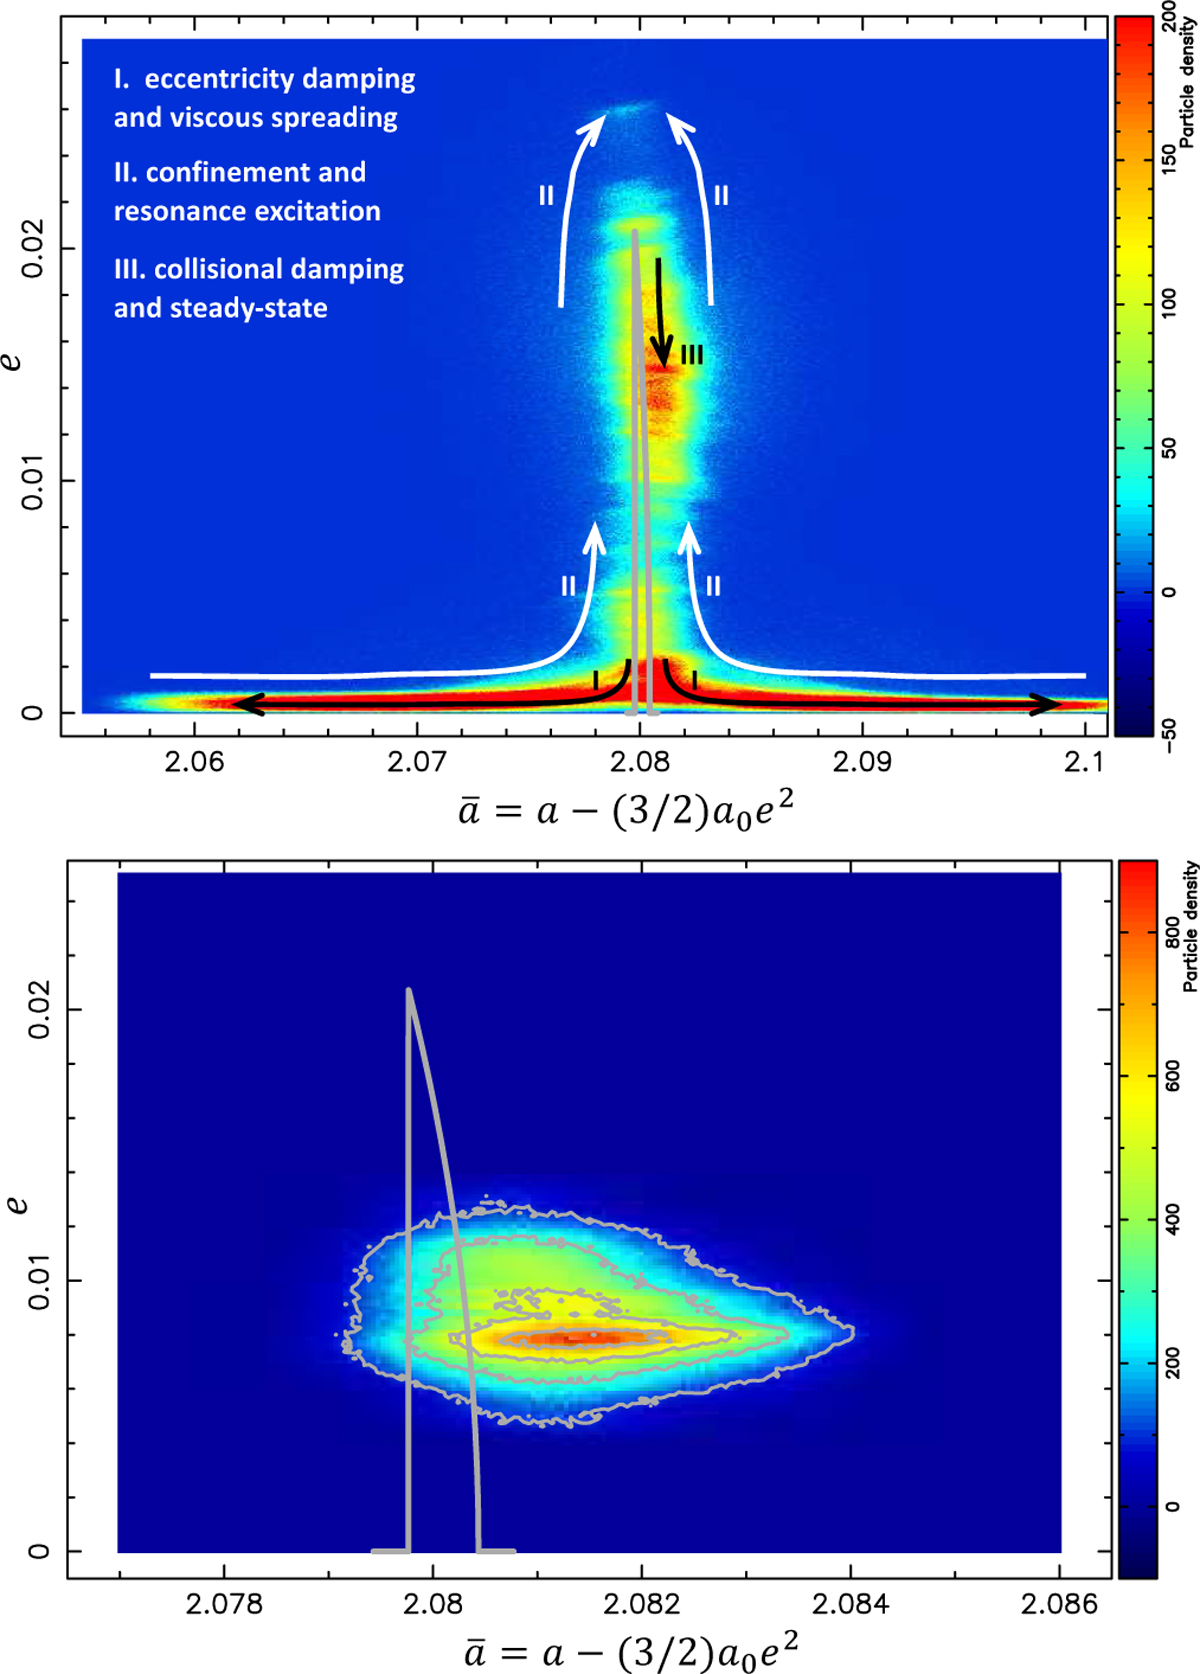
Fig. 7
Download original image
Upper panel: overview of the three phases shown in the upper panels of Fig. 6. The plot shows a stack of 1600 snapshots of the system from T = 120 000 to T = 200 000 (96 to 160 years respectively in the Chariklo case) with time steps ∆T = 50 Chariklo’s revolutions (about 15 days). The three phases I, II, and III described in the text are indicated by the arrows. Lower panel: phase III quasi-stationary stage obtained at the end of our run (we note the change in radial scale compared with the upper panel). A total of 780 snapshots taken from T = 256 500 to T = 257 280 (204.94 to 205.57 years) with time steps ∆T = 1 Chariklo’s revolution (about 7 h) have been stacked. A quasi steady state is reached, where the eccentricity damping due to collisions is balanced by the resonance excitation. On the long term (not reached here), a leakage of particles toward larger semimajor axes would be observed, as illustrated in Fig. 17, where a larger mass anomaly µ = 0.03 is used.
Current usage metrics show cumulative count of Article Views (full-text article views including HTML views, PDF and ePub downloads, according to the available data) and Abstracts Views on Vision4Press platform.
Data correspond to usage on the plateform after 2015. The current usage metrics is available 48-96 hours after online publication and is updated daily on week days.
Initial download of the metrics may take a while.