Fig. 8
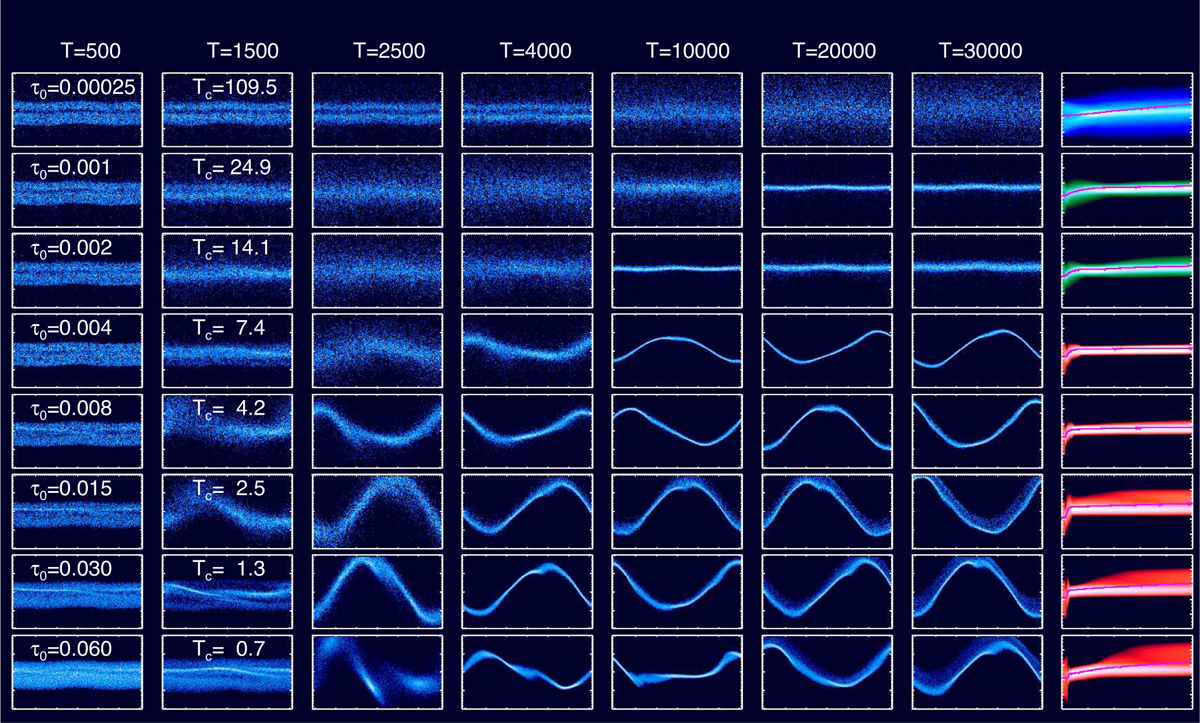
Download original image
Transition from noncollisional to collisional rings. This is explored by simulations with various initial optical depths τ0 from 0.00025 to 0.06, all using a mass anomaly µ = 0.1. Snapshots of the particle distributions in polar coordinates are shown at various times, using the radial range 1.88–2.28 centered around the resonant semimajor axis a1/3 ≈ 2.08. The label Tc in the second column indicates the average time interval between impacts, in units of the particle orbital periods. The rightmost column shows the time evolution of the vertical angular momentum Lz distribution with time up to 30 000 central body revolutions. The lowermost simulation (τ0 = 0.06) is the same as the one shown in the last row of Fig. 5, where it is displayed up to T = 5000.
Current usage metrics show cumulative count of Article Views (full-text article views including HTML views, PDF and ePub downloads, according to the available data) and Abstracts Views on Vision4Press platform.
Data correspond to usage on the plateform after 2015. The current usage metrics is available 48-96 hours after online publication and is updated daily on week days.
Initial download of the metrics may take a while.