Fig. 2
Download original image
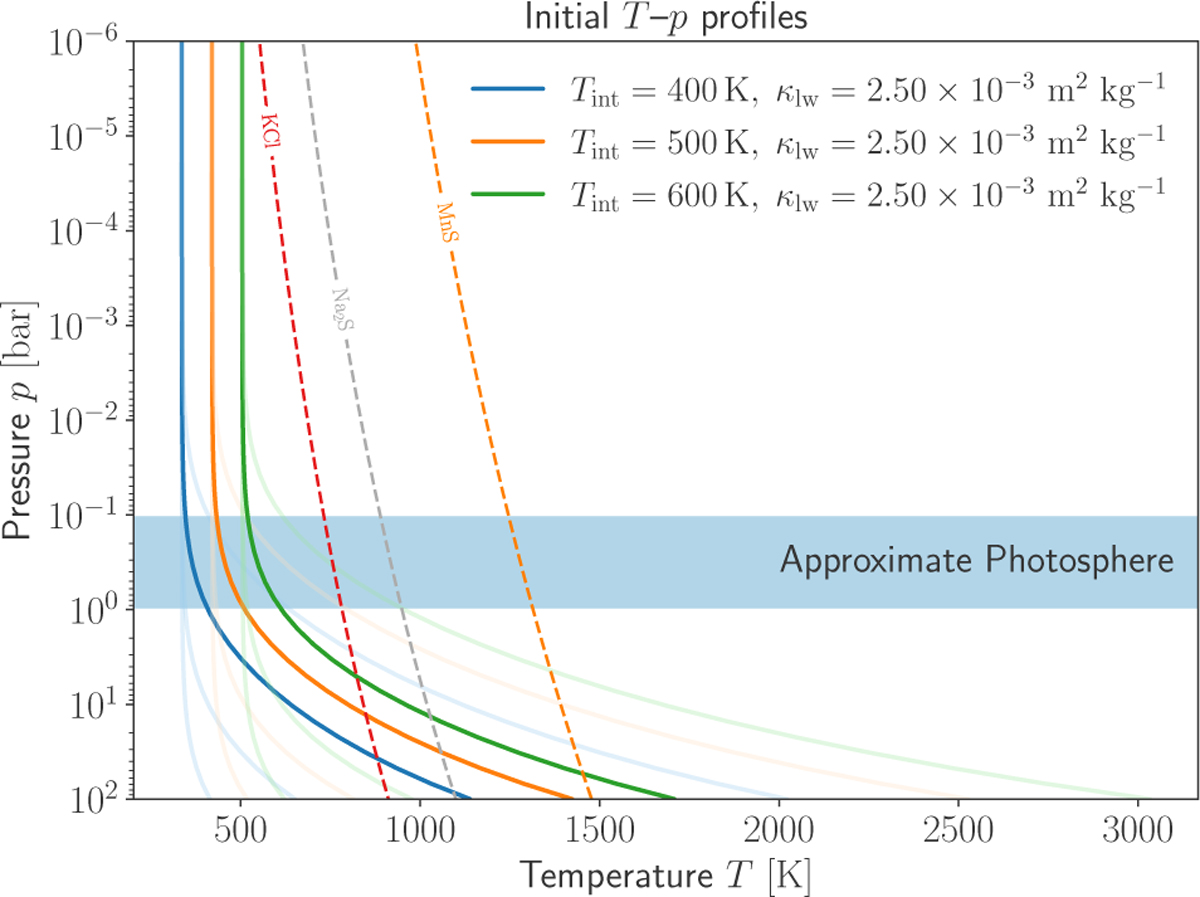
Various T–p profiles overplotted to illustrate the initial conditions from which the simulations were spun up. The solid lines correspond to the κlw = 2.5 × 10⁻³ m2 kg−1 curves with the lighter shades of each color illustration curves corresponding to the same internal temperature Tint with varying long-wave opacities of κlw = [2.5 × 10⁻⁵, 2.5 × 10⁻⁴, 2.5 × 10⁻²] m2 kg−1. Also overplotted are condensation curves for the cloud condensate species KCl, MnS, Na2S. The shaded horizontal region (p = 0.1 – 1 bar) corresponds to the approximate photosphere.
Current usage metrics show cumulative count of Article Views (full-text article views including HTML views, PDF and ePub downloads, according to the available data) and Abstracts Views on Vision4Press platform.
Data correspond to usage on the plateform after 2015. The current usage metrics is available 48-96 hours after online publication and is updated daily on week days.
Initial download of the metrics may take a while.