Fig. 5
Download original image
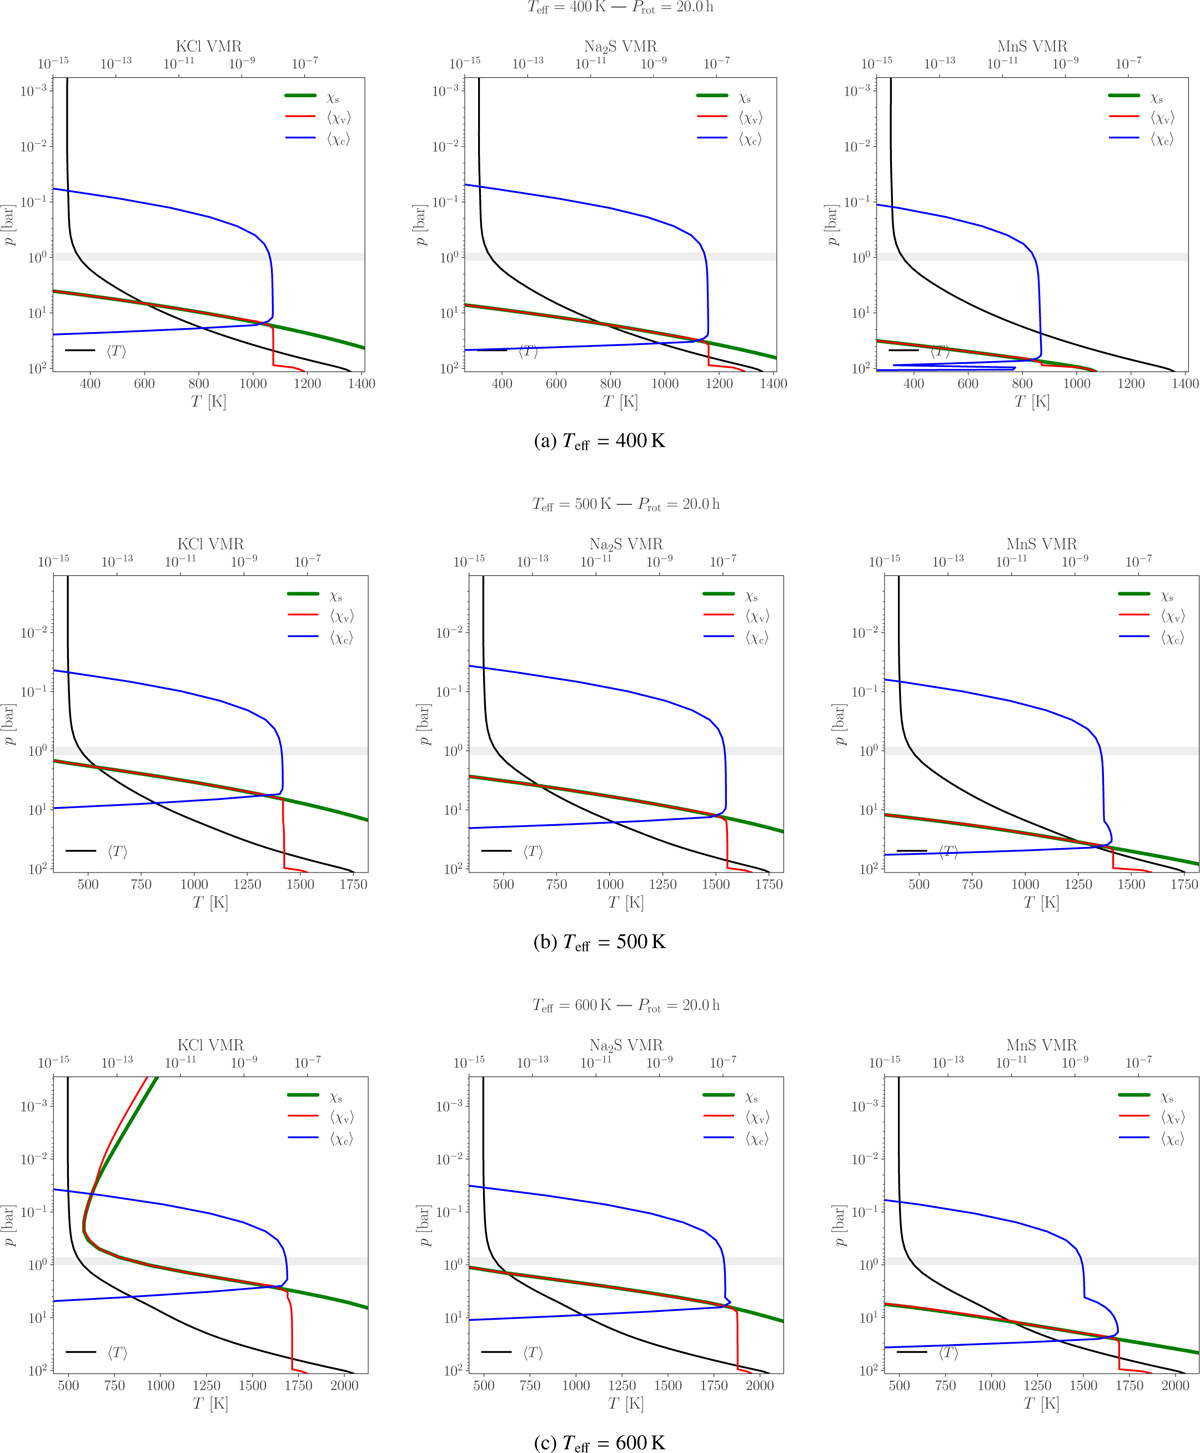
Globally averaged vertical profiles of cloud condensate (blue) and vapor (red) VMRs, together with the saturation vapor VMR (green), for three cloud species (columns, left to right: KCl, Na2S, MnS) and three effective temperatures (rows, top to bottom: 400–600 K). Each panel shows results at a simulation time of trun = 1000 d, averaged over the final 10 days, for a fixed rotation period of Prot = 20 h. The horizontal gray shaded area marks the photosphere for the single-band thermal emission.
Current usage metrics show cumulative count of Article Views (full-text article views including HTML views, PDF and ePub downloads, according to the available data) and Abstracts Views on Vision4Press platform.
Data correspond to usage on the plateform after 2015. The current usage metrics is available 48-96 hours after online publication and is updated daily on week days.
Initial download of the metrics may take a while.