Fig. 7
Download original image
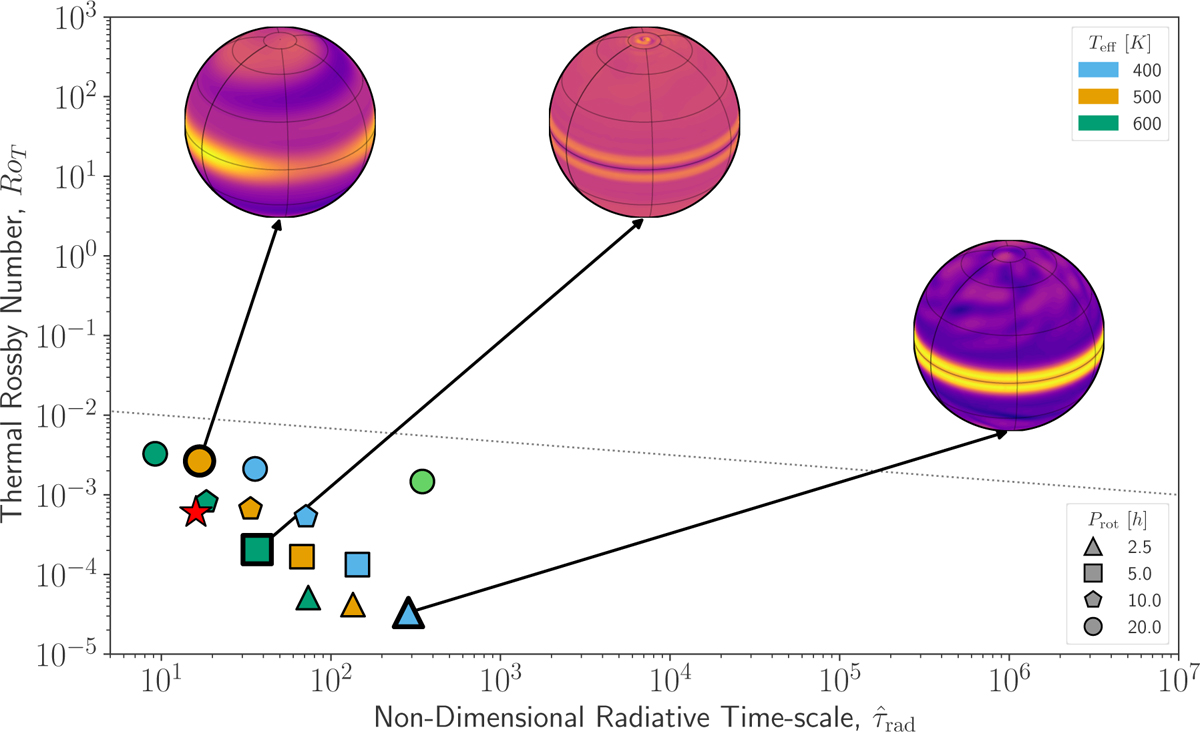
Thermal Rossby number RoT plotted against the non-dimensional radiative timescale ![]() for the complete sample of planets discussed in this study. The plotted quantities are calculated according to the definitions given in Sect. 2.1 and at the approximate photosphere corresponding to p = 0.7 bar. Chosen examples are highlighted together with their OLR profiles overplotted in the figure. The dashed lines correspond to a boundary between circulation regimes identified by Hammond et al. (2023). The red star is included as a reference point, the same as in Figure 1, corresponding to a run case of (Teff = 400 K; Prot = 10 h; log g = 4.46) from a recent GCM study.
for the complete sample of planets discussed in this study. The plotted quantities are calculated according to the definitions given in Sect. 2.1 and at the approximate photosphere corresponding to p = 0.7 bar. Chosen examples are highlighted together with their OLR profiles overplotted in the figure. The dashed lines correspond to a boundary between circulation regimes identified by Hammond et al. (2023). The red star is included as a reference point, the same as in Figure 1, corresponding to a run case of (Teff = 400 K; Prot = 10 h; log g = 4.46) from a recent GCM study.
Current usage metrics show cumulative count of Article Views (full-text article views including HTML views, PDF and ePub downloads, according to the available data) and Abstracts Views on Vision4Press platform.
Data correspond to usage on the plateform after 2015. The current usage metrics is available 48-96 hours after online publication and is updated daily on week days.
Initial download of the metrics may take a while.