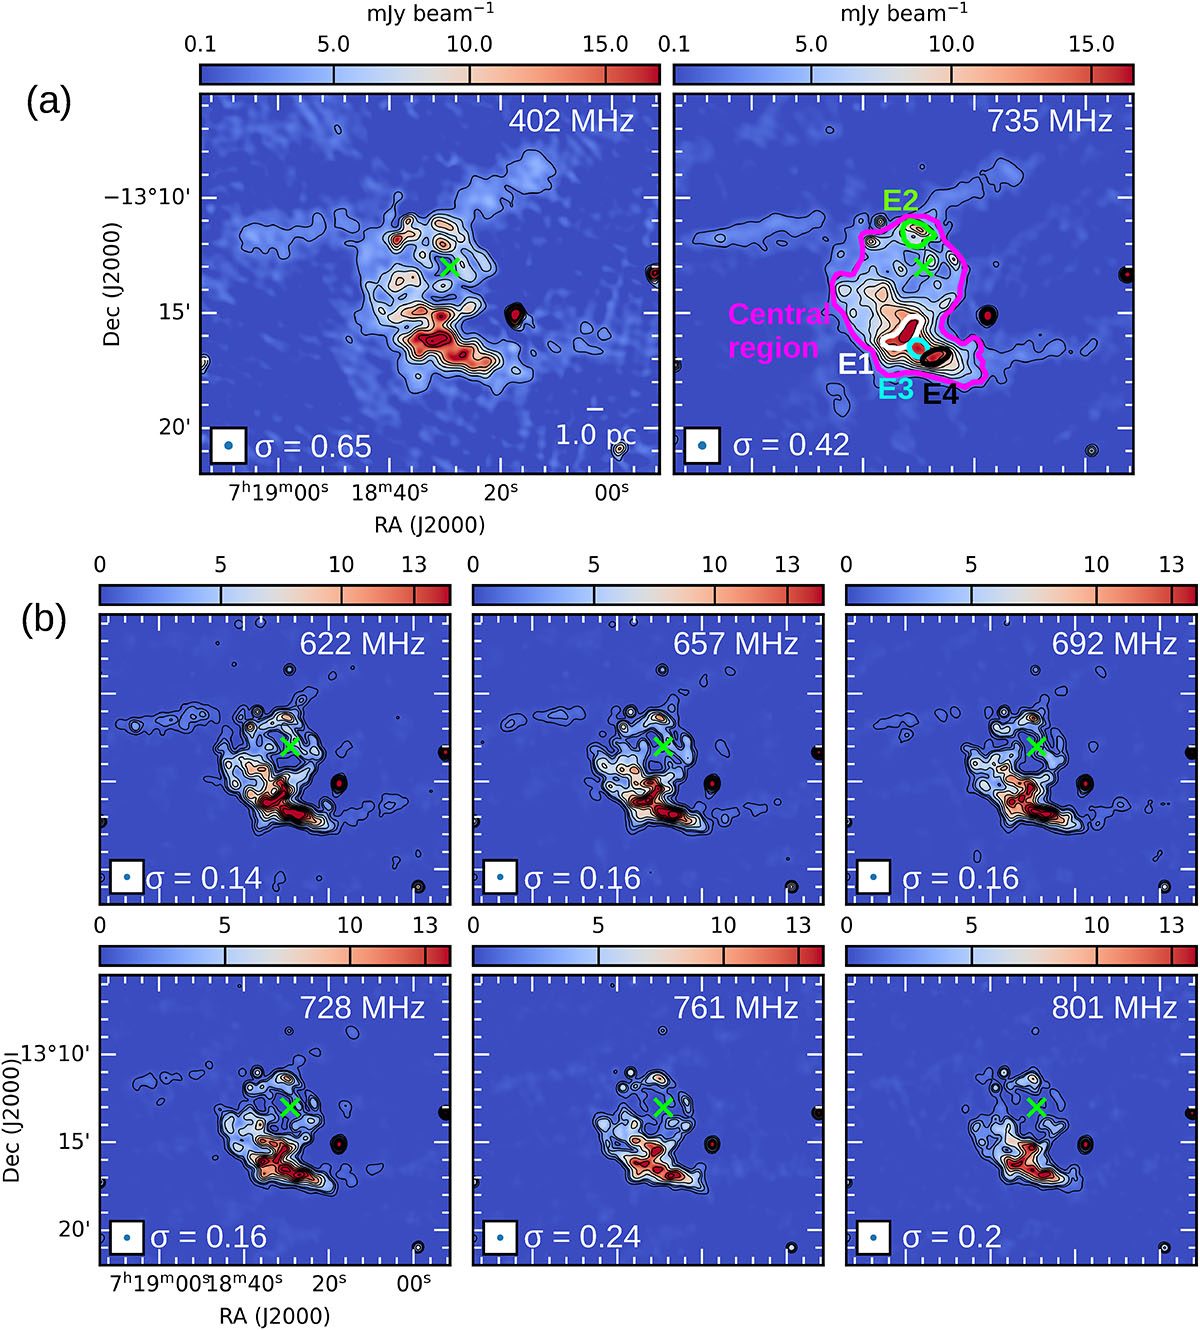
Fig. 2.
Download original image
Radio maps of NGC 2359 obtained using our uGMRT data. (a) Maps obtained using the full-band data. (b) Sub-band images for Band-4 data. All maps are convolved to a circular beam of 22″. For each map, the central frequency and rms noise (σ) in units of mJy beam−1 are mentioned in each panel. The “X” marks the location of the star in all the panels. Identified apertures (E1–E4) and the central region used to obtain the SEDs are shown in the 735 MHz map. Contour levels are as follows: (i) For maps with central frequencies of 402 and 735 MHz, contour levels start from 3σ and increase in steps of 4σ. (ii) The maps with central frequencies of 622, 657, 692, and 728 MHz have contour levels of [3, 8, 13, 28, 43, 58, 73, 88, 103, 118] × σ. (iii) For maps with central frequencies of 761 and 801 MHz, the contour levels are [3, 8, 13, 28, 43, 58, 73] × σ. In all panels, the contours are smoothed over 3 pixels using a Gaussian kernel.
Current usage metrics show cumulative count of Article Views (full-text article views including HTML views, PDF and ePub downloads, according to the available data) and Abstracts Views on Vision4Press platform.
Data correspond to usage on the plateform after 2015. The current usage metrics is available 48-96 hours after online publication and is updated daily on week days.
Initial download of the metrics may take a while.