Fig. 1.
Download original image
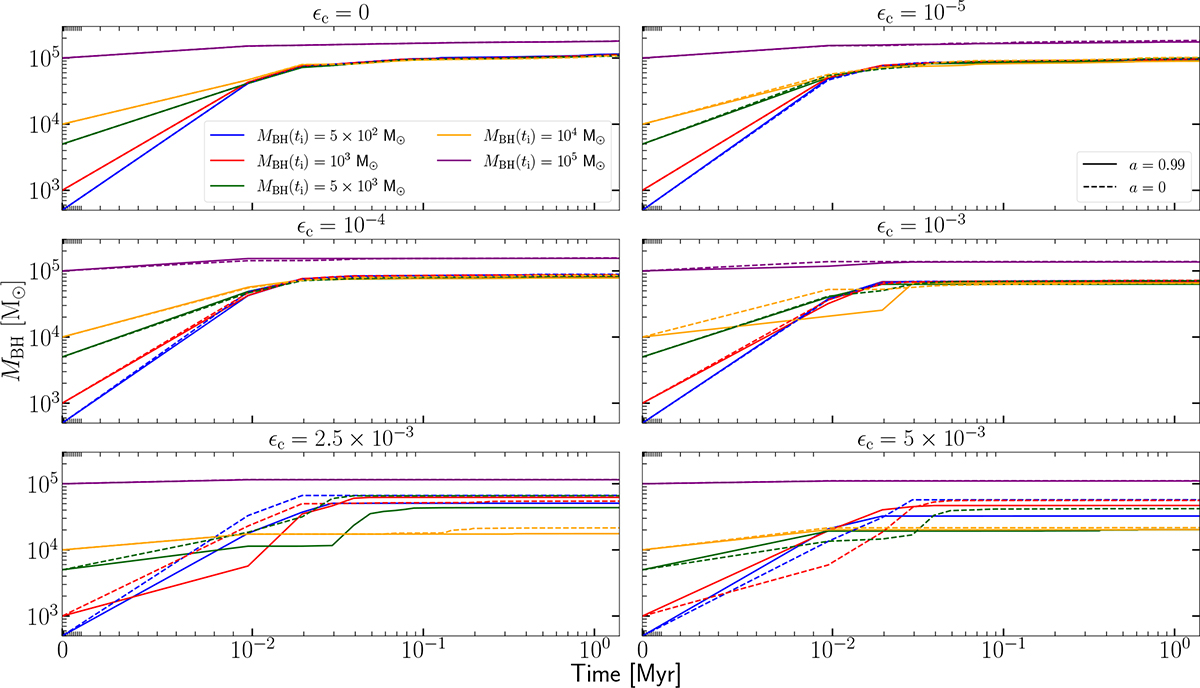
Evolution of the BH mass for all the tested BH seeds, grouped by ϵc. Different colours indicate the initial BH mass, whereas the line style denotes the BH spin: solid lines for a = 0.99 and dashed lines for a = 0. The x-axis is shown using a symmetric logarithmic scale with a linear threshold of 10−2 to allow visibility near t = 0 while preserving a logarithmic behaviour at larger values.
Current usage metrics show cumulative count of Article Views (full-text article views including HTML views, PDF and ePub downloads, according to the available data) and Abstracts Views on Vision4Press platform.
Data correspond to usage on the plateform after 2015. The current usage metrics is available 48-96 hours after online publication and is updated daily on week days.
Initial download of the metrics may take a while.