Open Access
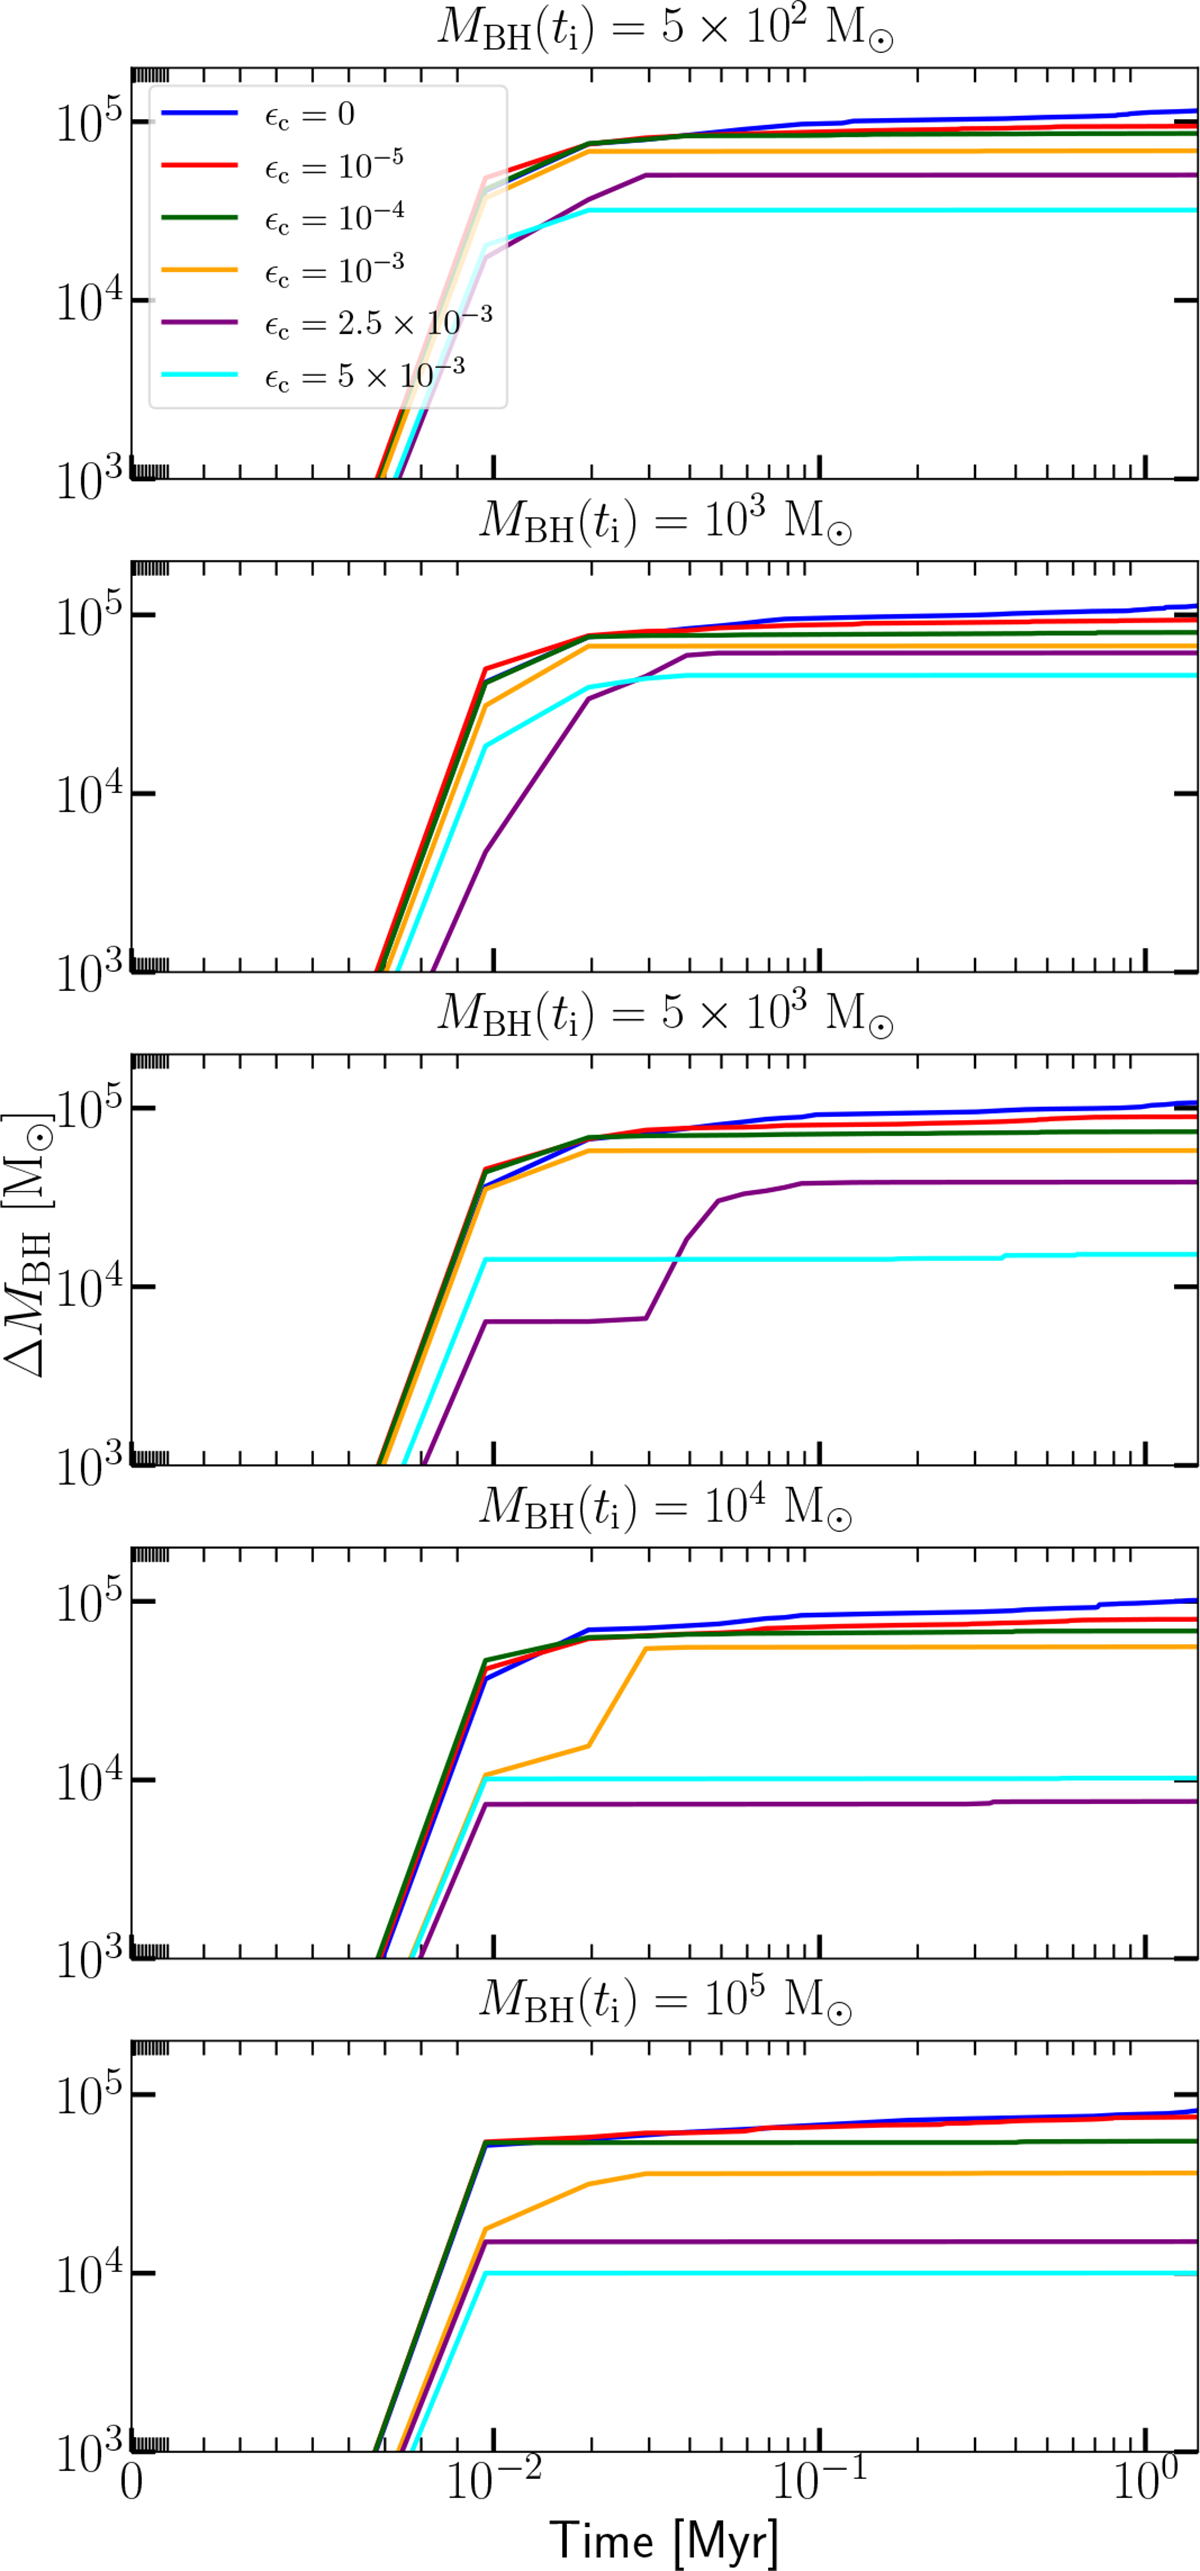
Fig. 2.
Download original image
Evolution of the accreted mass ΔMBH ≡ MBH(t)−MBH(ti) for all the tested BH seeds with a = 0.99 and different coupling efficiencies. Each plot refers to a different initial mass. Different colours indicate the coupling efficiency ϵc. The same symmetric logarithmic scale and linear threshold of Fig. 1 are adopted here.
Current usage metrics show cumulative count of Article Views (full-text article views including HTML views, PDF and ePub downloads, according to the available data) and Abstracts Views on Vision4Press platform.
Data correspond to usage on the plateform after 2015. The current usage metrics is available 48-96 hours after online publication and is updated daily on week days.
Initial download of the metrics may take a while.