Fig. 3.
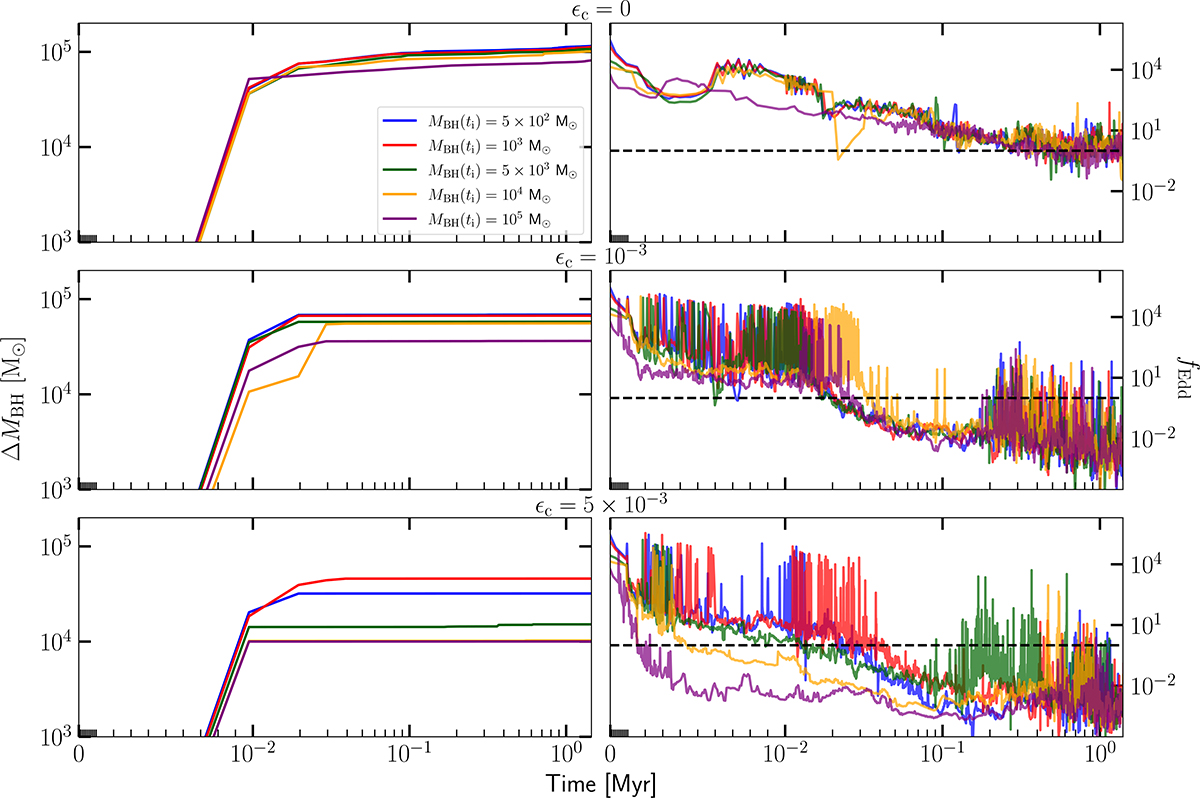
Download original image
Accreted mass ΔMBH [M⊙] (left-hand column) and Eddington ratio fEdd ≡ Ṁacc/ṀEdd (right-hand column) evolution grouped by feedback intensity for three regimes – ϵc = 0, 10−3, and 5 × 10⁻³ – from top to bottom, assuming a spin of a = 0.99. The Eddington limit is marked by the dashed black line. The same colour-coding and symmetric logarithmic x-axis as in Fig. 1 are used throughout. In the bottommost left-hand panel, the yellow curve is nearly indistinguishable from the purple one, as the two are almost perfectly overlapped.
Current usage metrics show cumulative count of Article Views (full-text article views including HTML views, PDF and ePub downloads, according to the available data) and Abstracts Views on Vision4Press platform.
Data correspond to usage on the plateform after 2015. The current usage metrics is available 48-96 hours after online publication and is updated daily on week days.
Initial download of the metrics may take a while.