Fig. 5.
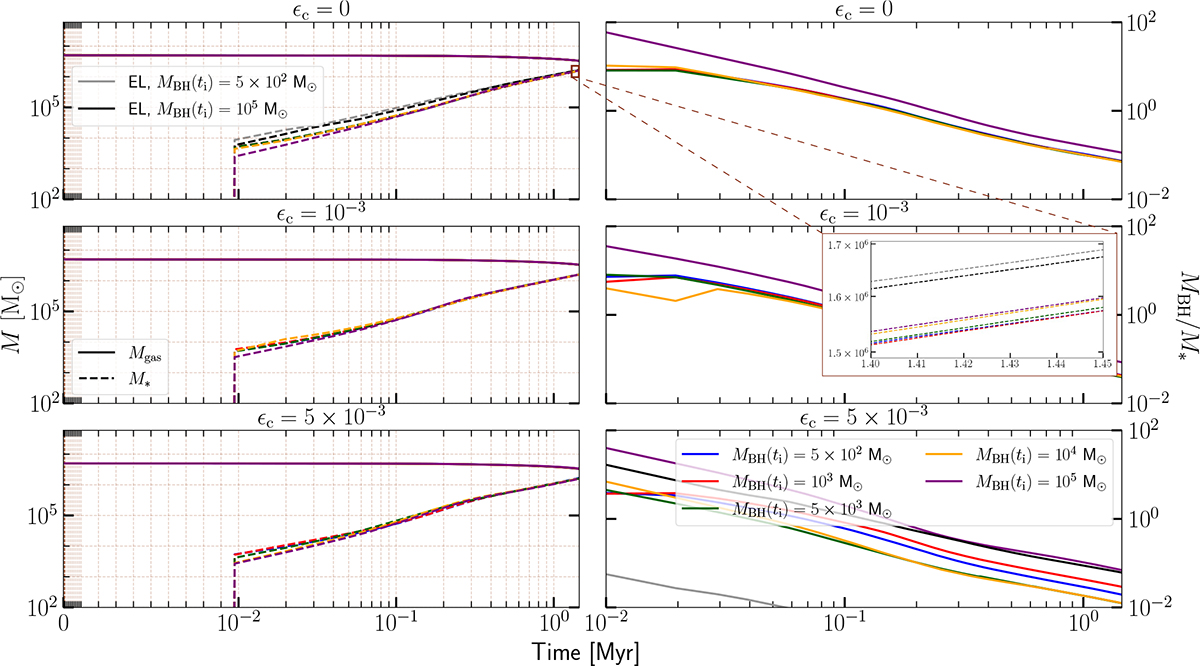
Download original image
Left-hand panels: Evolution of the total gas mass (solid lines) and stellar mass (dashed lines) within the entire disc for the three feedback cases under analysis (i.e. ϵc = 0, 10−3, and 5 × 10⁻³, from top to bottom). The inset magnifies the terminal part of the stellar evolution lines in the top-left panel (the no-feedback case), where the curves overlap. The right-hand panels show the evolution of the MBH/M* ratio. Different colours indicate the various initial BH masses, following the same colour scheme used in Fig. 1. For reference, the Eddington-limited (‘EL’ in the figure) cases with MBH(ti) = 5 × 10² and MBH(ti) = 105 and ϵc = 0 are included in the corresponding panel. The same symmetric logarithmic scale and linear threshold of Fig. 1 are applied to the x-axis in the left-hand column, whereas a full logarithmic scale is used in the right-hand column, with the origin set at t = 10−2 Myr, approximately corresponding to the onset of the first SF episodes.
Current usage metrics show cumulative count of Article Views (full-text article views including HTML views, PDF and ePub downloads, according to the available data) and Abstracts Views on Vision4Press platform.
Data correspond to usage on the plateform after 2015. The current usage metrics is available 48-96 hours after online publication and is updated daily on week days.
Initial download of the metrics may take a while.