Open Access
Fig. 6.
Download original image
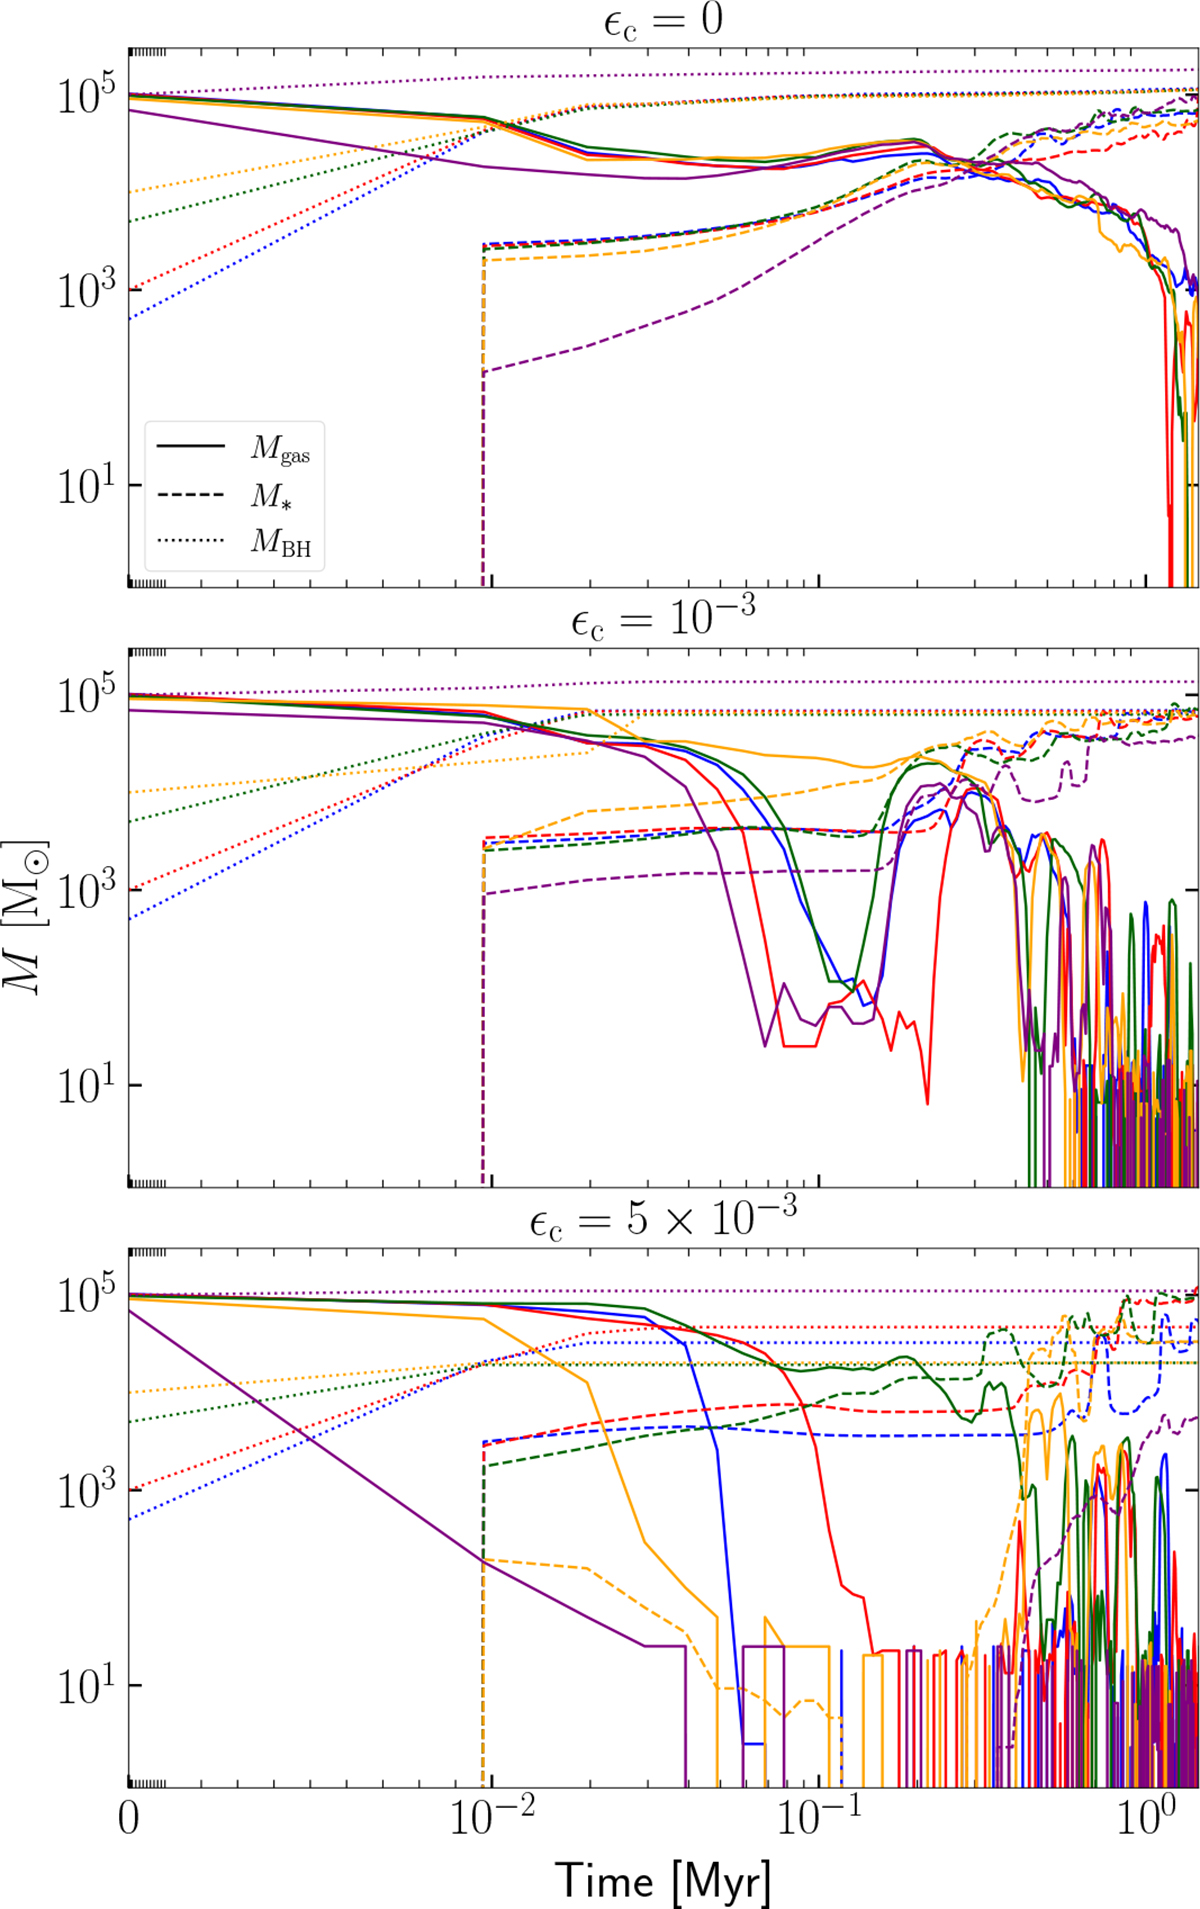
Same as in the left-hand panels of Fig. 5 but, for the same three values of ϵc and colour-coding, the evolution of the gas mass (solid lines), stellar mass (dashed lines), and MBH (dotted lines) are computed within 1 pc from the BH.
Current usage metrics show cumulative count of Article Views (full-text article views including HTML views, PDF and ePub downloads, according to the available data) and Abstracts Views on Vision4Press platform.
Data correspond to usage on the plateform after 2015. The current usage metrics is available 48-96 hours after online publication and is updated daily on week days.
Initial download of the metrics may take a while.