Open Access
Fig. 7.
Download original image
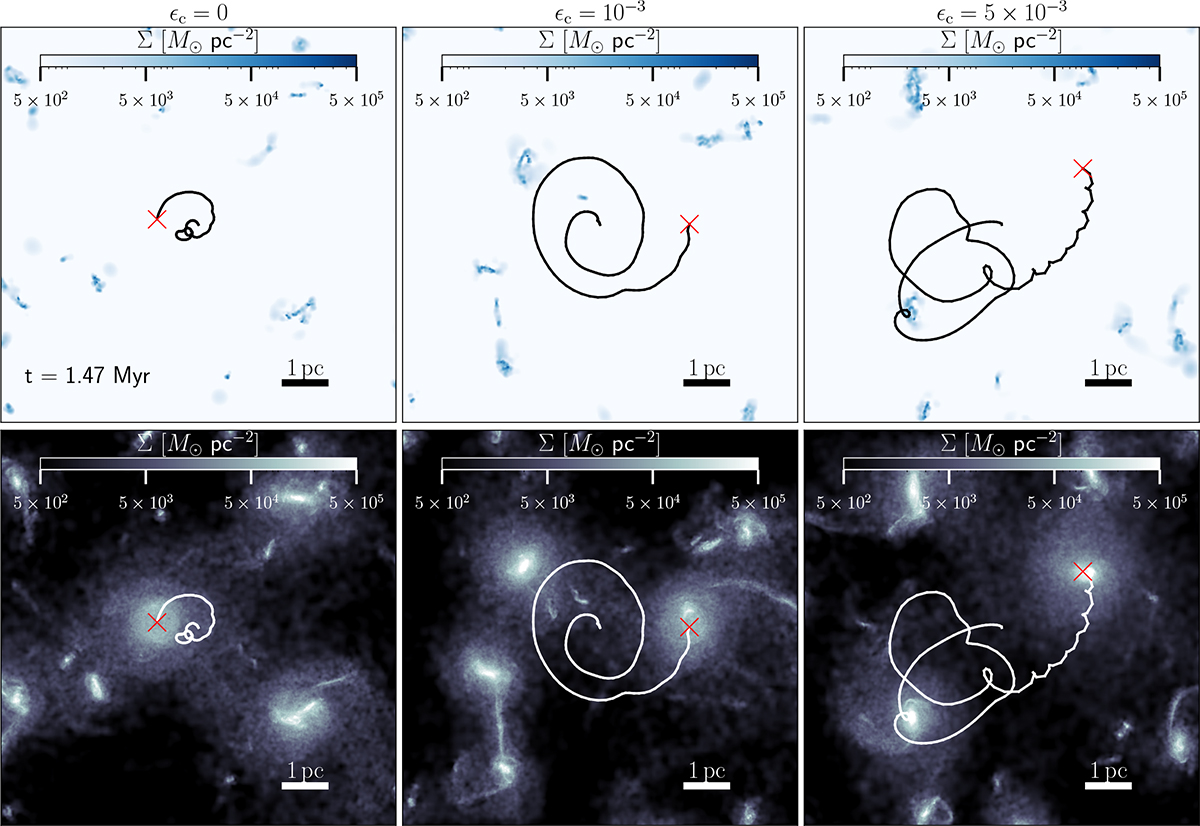
Surface density maps (Σ) of the gas (top row) and stellar (bottom row) components at the final snapshots of the simulations with MBH(ti) = 5 × 10³ M⊙, shown for three different feedback regimes of interest. The BH orbit is traced in black (top row) and white (bottom row), with the current BH position marked by a red cross.
Current usage metrics show cumulative count of Article Views (full-text article views including HTML views, PDF and ePub downloads, according to the available data) and Abstracts Views on Vision4Press platform.
Data correspond to usage on the plateform after 2015. The current usage metrics is available 48-96 hours after online publication and is updated daily on week days.
Initial download of the metrics may take a while.