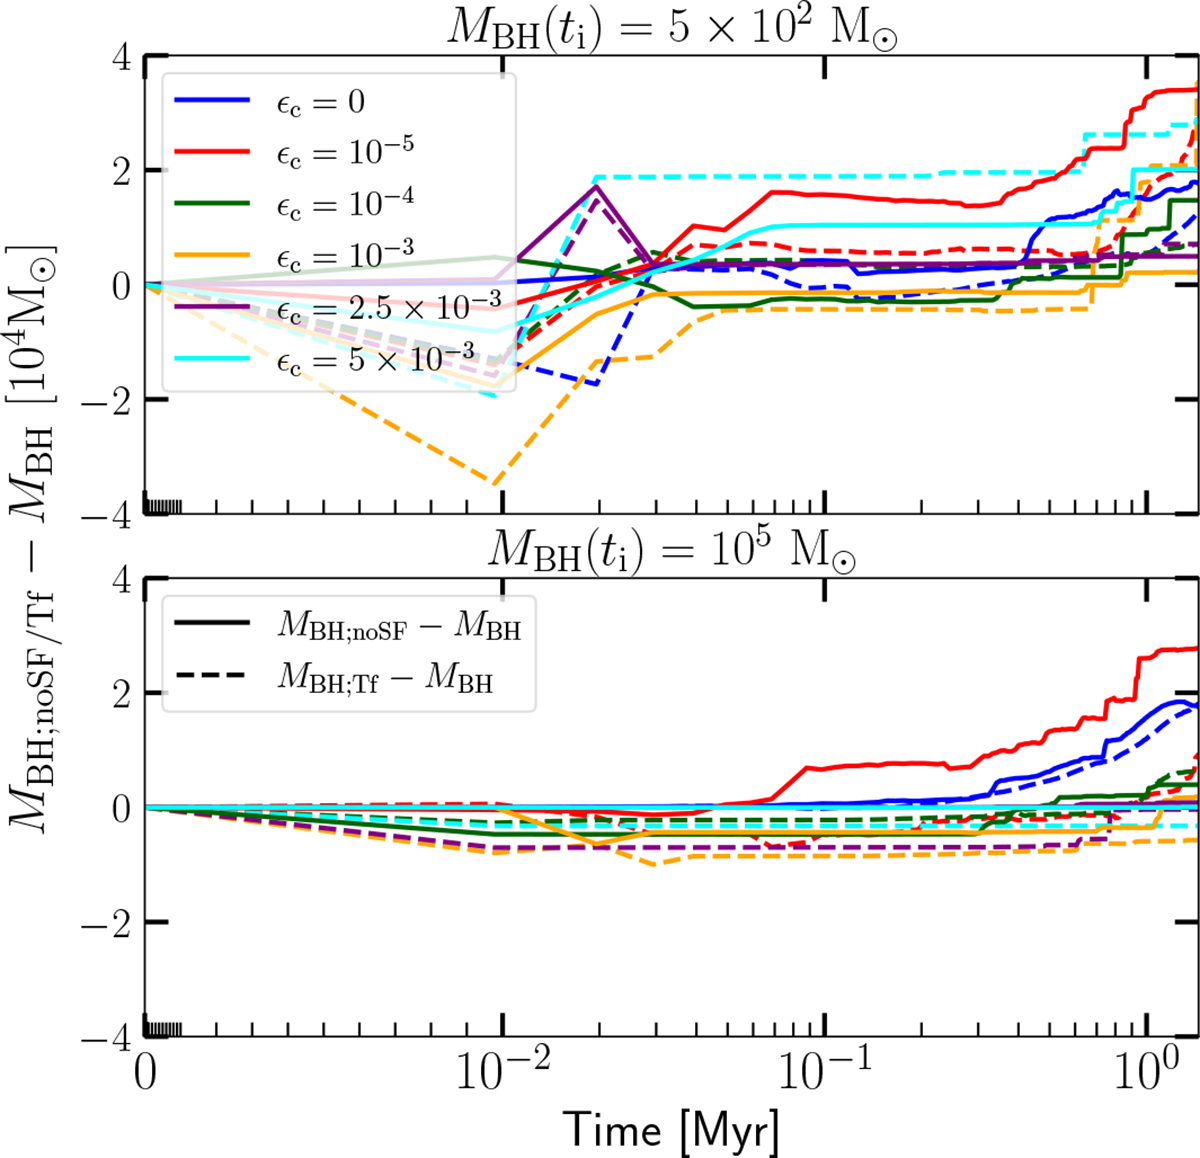
Fig. 8.
Download original image
Mass difference between the BH masses MBH; noSF – obtained from the simulations without SF (noSF, solid lines) – or MBH; Tf – from simulations without SF and with an increased temperature floor (Tf, dashed lines) – and the reference masses MBH. The same x-axis and colour-coding as in Fig. 2 are used. The upper panel refers to the suite with MBH(ti) = 5 × 10² M⊙, whereas the lower panel refers to the suite with MBH(ti) = 105 M⊙.
Current usage metrics show cumulative count of Article Views (full-text article views including HTML views, PDF and ePub downloads, according to the available data) and Abstracts Views on Vision4Press platform.
Data correspond to usage on the plateform after 2015. The current usage metrics is available 48-96 hours after online publication and is updated daily on week days.
Initial download of the metrics may take a while.