Fig. 1.
Download original image
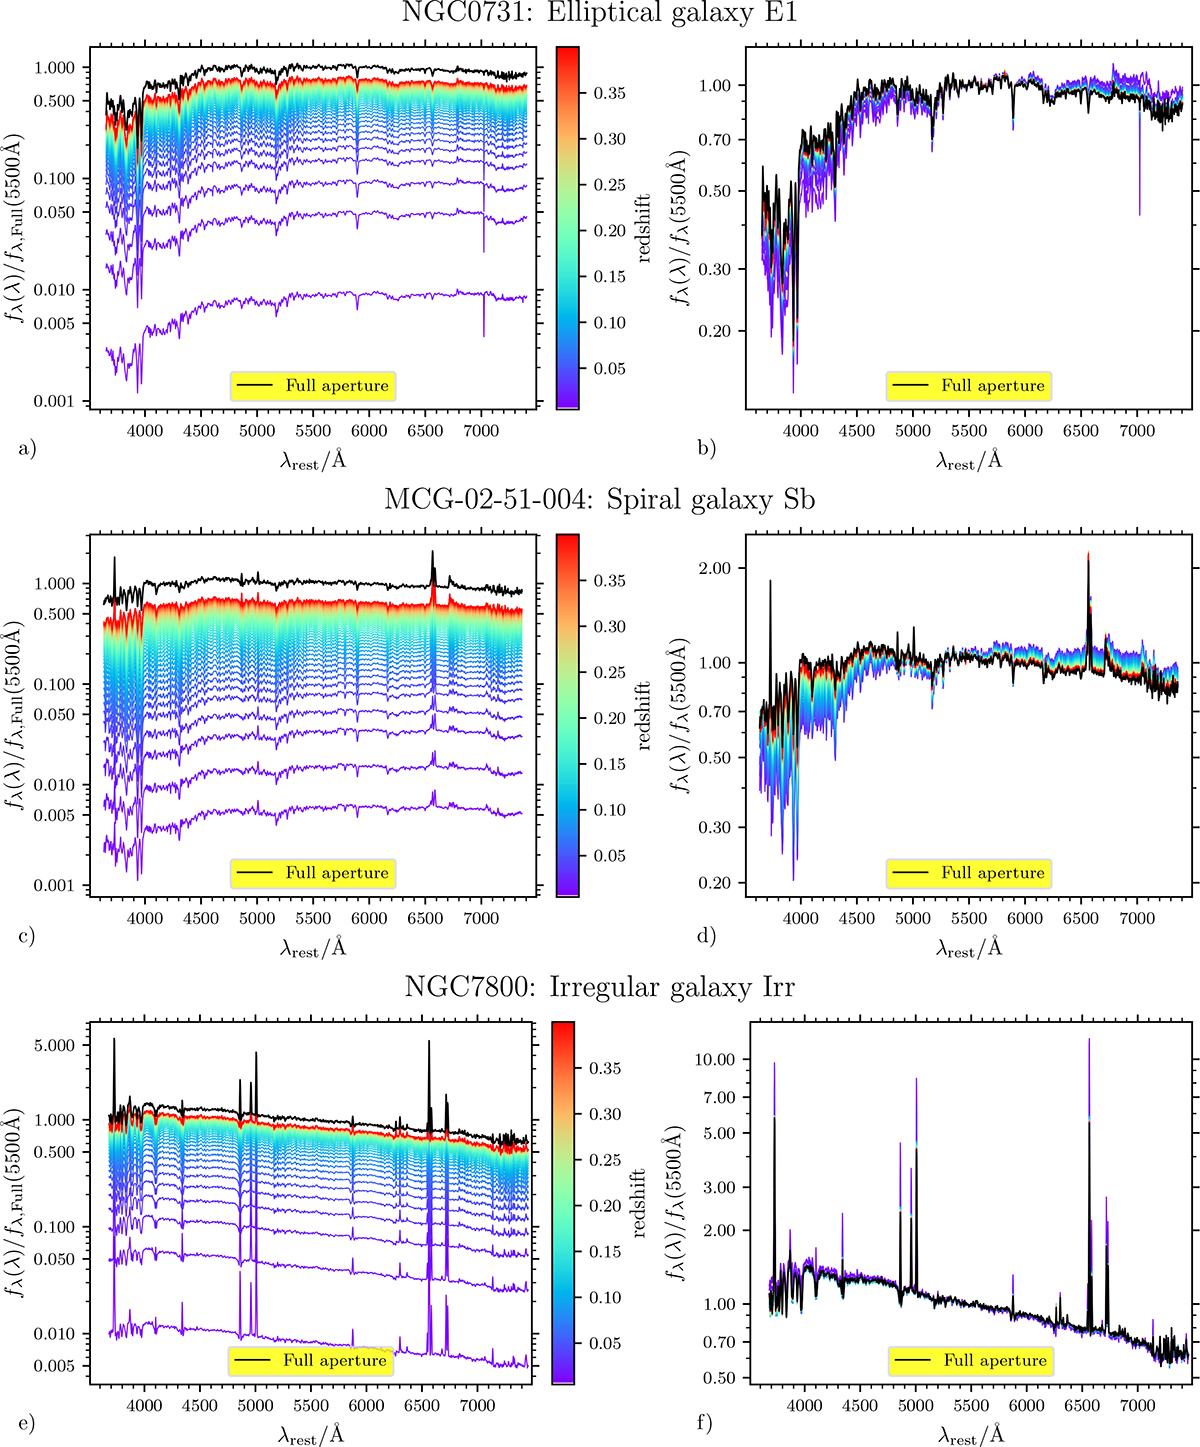
Spectra of three galaxies of different morphological types (elliptical, Sb spiral, and irregular) simulated to reproduce what the SDSS fiber-fed spectrograph would see over a redshift range between 0.005 and 0.4. We note the log scale in the y-axis. In all panels, the black spectrum is the one obtained from the light integrated over the full galaxy footprint of the galaxy, normalized at 5500 Å. The colored spectra are the simulated fiber-spectra at the redshift indicated by the color bar. In the left panel of each galaxy (a, c, e), the fiber spectra are normalized relative to the total flux in the footprint in order to emphasize the flux loss from the fiber. In the right panels (b, d, f), all spectra are normalized to the flux density at 5500 Å in order to emphasize the changes in spectral shape and features.
Current usage metrics show cumulative count of Article Views (full-text article views including HTML views, PDF and ePub downloads, according to the available data) and Abstracts Views on Vision4Press platform.
Data correspond to usage on the plateform after 2015. The current usage metrics is available 48-96 hours after online publication and is updated daily on week days.
Initial download of the metrics may take a while.