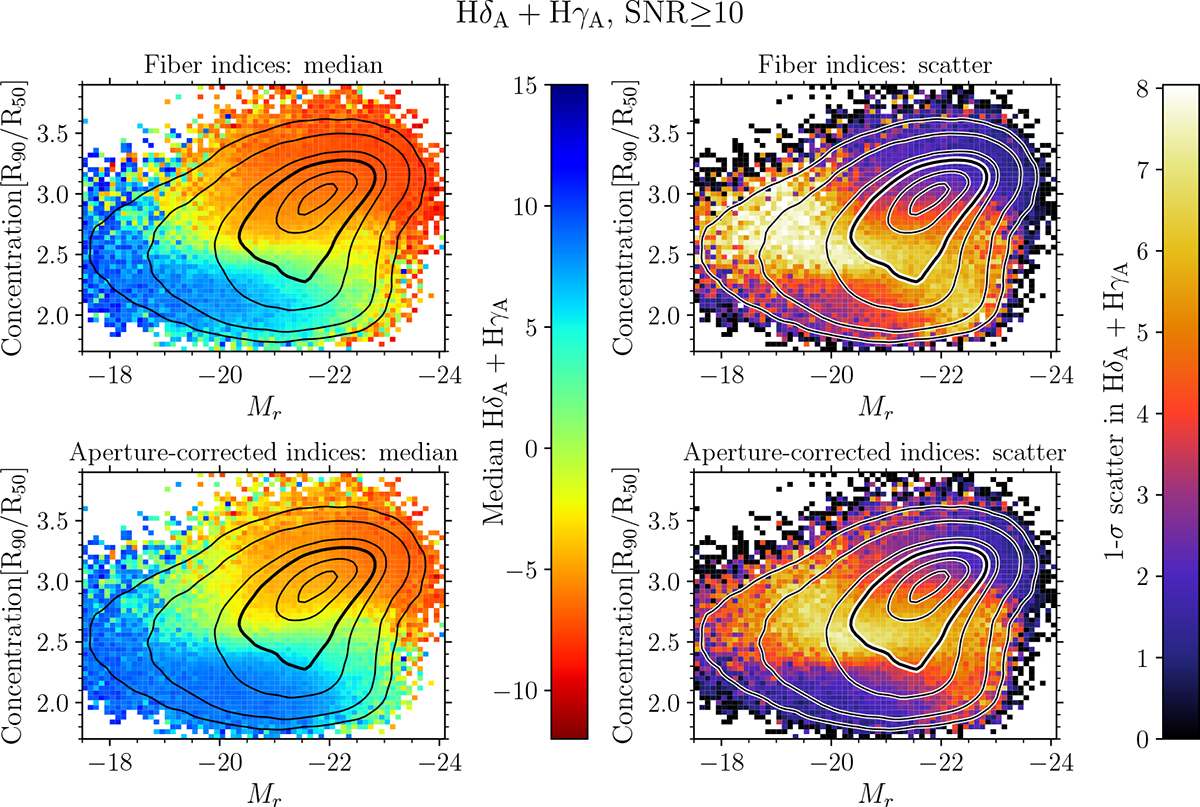
Fig. B.1.
Download original image
Maps of the median HδA + HγA and its scatter (computed as one-half of the 16th–84th percentile range) for SDSS-DR7 galaxies with S/N ≥ 10 in 2D bins in the plane of concentration vs. absolute r-band magnitude Mr. The maps in the top row are obtained with the original fiber indices, while those in the bottom row are computed with aperture-corrected indices. Iso-density contours are overlaid, including fractions of 0.05, 0.20, 0.50 (thick contour), 0.75, 0.95, and 0.99 of the sample, respectively.
Current usage metrics show cumulative count of Article Views (full-text article views including HTML views, PDF and ePub downloads, according to the available data) and Abstracts Views on Vision4Press platform.
Data correspond to usage on the plateform after 2015. The current usage metrics is available 48-96 hours after online publication and is updated daily on week days.
Initial download of the metrics may take a while.