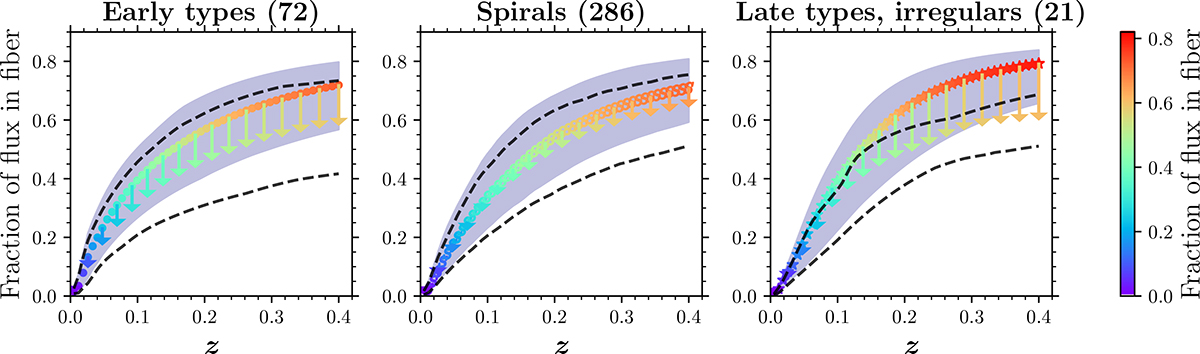
Fig. 2.
Download original image
Trends of fractions of flux collected in fiber as a function of redshift for three broad morphological classes: ETGs (left panel), spirals (central panel), and late-type and irregular galaxies (right panel). The colored points (shaded gray areas) represent the median (16th–84th percentile range) fractions relative to the footprint (see Sect. 2.3). The vertical arrows point to the median fractions relative to the growth-curve (GC) integrated flux (i.e., the footprint fraction times the fiber fraction relative to the footprint). The dashed lines indicate the 16th and 84th percentiles for the fraction relative to the total GC flux.
Current usage metrics show cumulative count of Article Views (full-text article views including HTML views, PDF and ePub downloads, according to the available data) and Abstracts Views on Vision4Press platform.
Data correspond to usage on the plateform after 2015. The current usage metrics is available 48-96 hours after online publication and is updated daily on week days.
Initial download of the metrics may take a while.