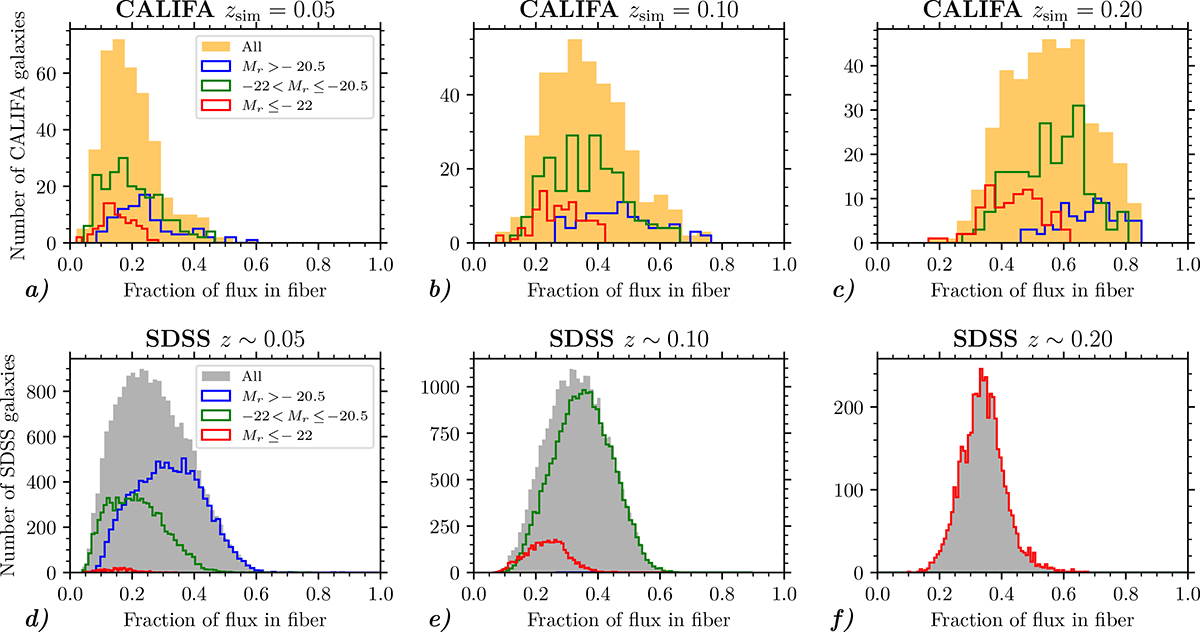
Fig. 3.
Download original image
Distributions of the fractions of flux in fiber for the CALIFA simulated spectra (top row) and the SDSS sample (bottom row), at three redshifts: z = 0.05, 0.10, 0.20. The orange shaded histogram represents the full CALIFA sample, while the gray-shaded histogram is the distribution for the full SDSS (S/N > 10) sample at the given redshift slice. The red, blue, and green histograms for both CALIFA and SDSS are made for three different bins of absolute magnitude, as indicated in the legend. We note that the fiber fraction for CALIFA is relative to footprint flux, while for the SDSS it is relative to the Petrosian magnitude.
Current usage metrics show cumulative count of Article Views (full-text article views including HTML views, PDF and ePub downloads, according to the available data) and Abstracts Views on Vision4Press platform.
Data correspond to usage on the plateform after 2015. The current usage metrics is available 48-96 hours after online publication and is updated daily on week days.
Initial download of the metrics may take a while.