Fig. 4.
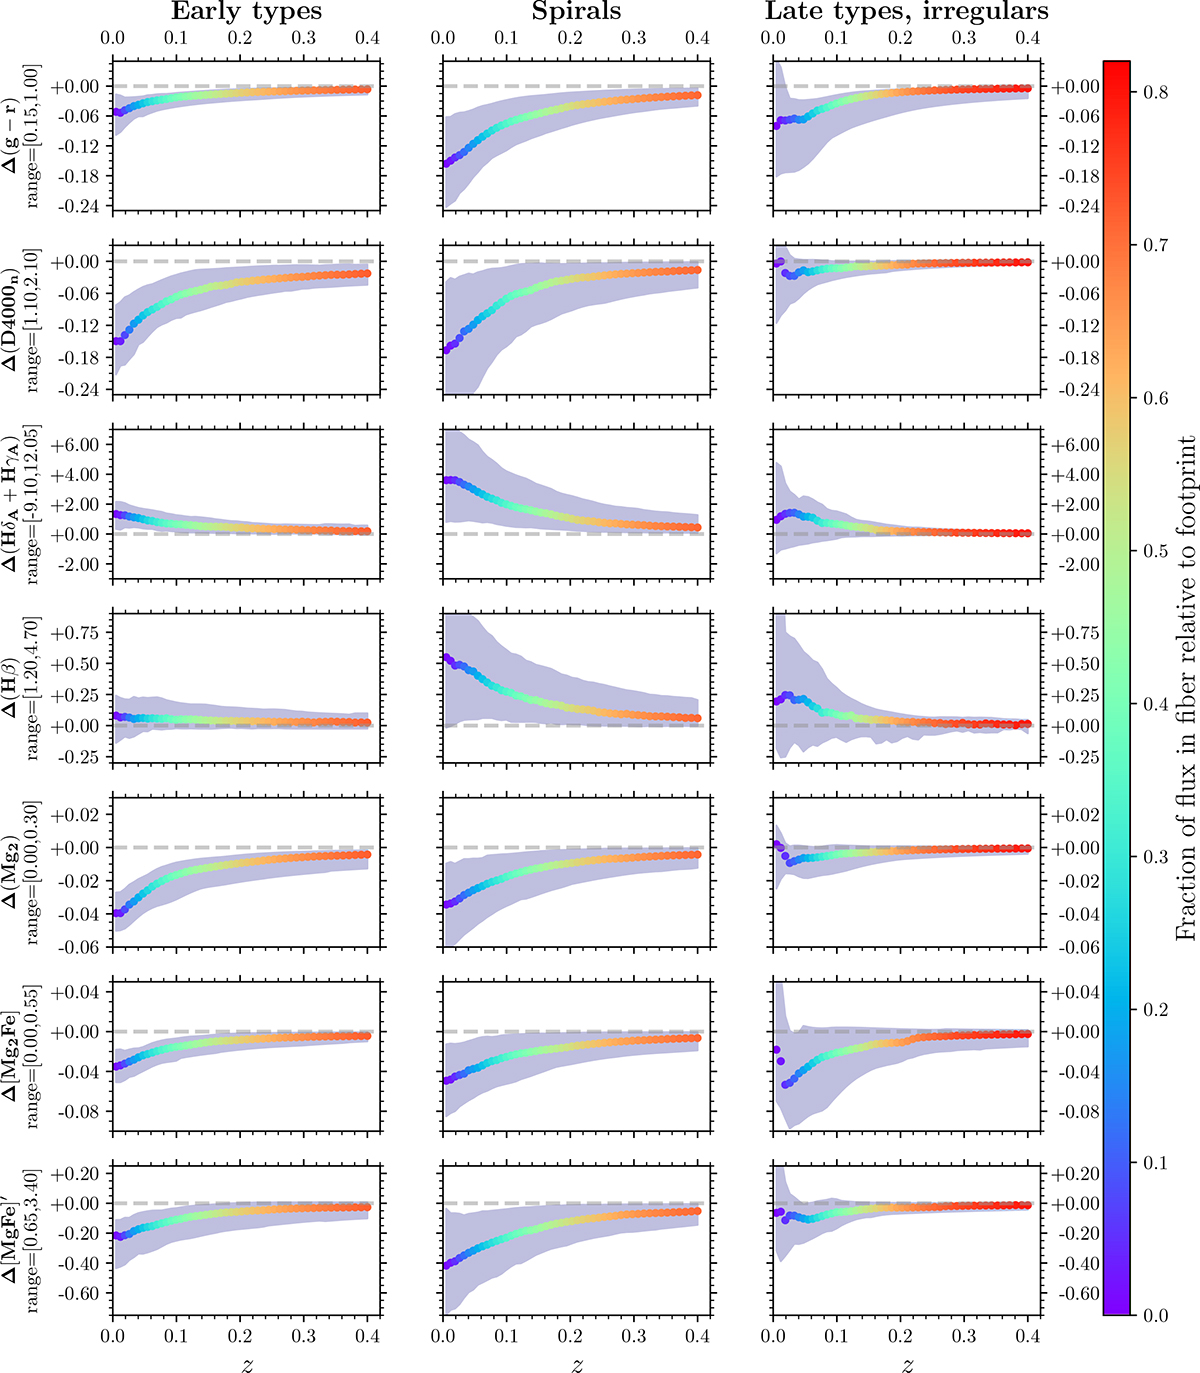
Download original image
Trends of differences between indices from full integrated light and from the fiber-aperture flux (i.e., the aperture bias) as a function of redshift, for the three morphological subsamples defined in Sect. 2.3. The points indicate the median trends and are colored according to the median fraction of flux in fiber as indicated by the color bar. The gray-shaded area displays the 16th − 84th percentile range, while the dashed horizontal line is the zero reference. The dynamic range of each index is given as a reference to evaluate the relevance of the aperture bias.
Current usage metrics show cumulative count of Article Views (full-text article views including HTML views, PDF and ePub downloads, according to the available data) and Abstracts Views on Vision4Press platform.
Data correspond to usage on the plateform after 2015. The current usage metrics is available 48-96 hours after online publication and is updated daily on week days.
Initial download of the metrics may take a while.