Fig. 5.
Download original image
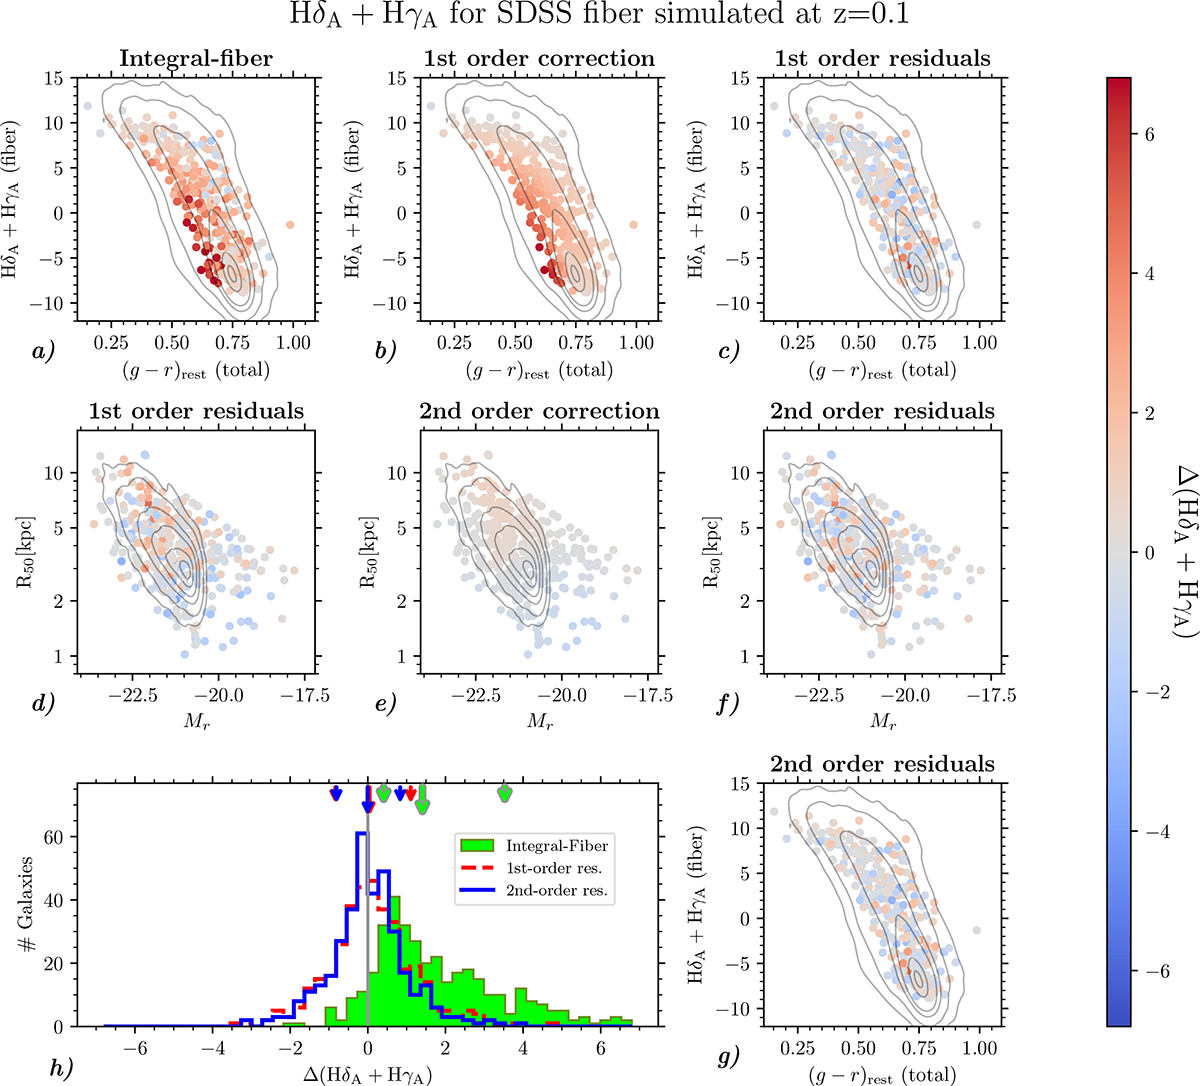
Illustration of the aperture-correction flow for the case of the HδA + HγA index at z = 0.1. In panels a–g the filled circles represent CALIFA simulated spectra, color-coded by the difference Δ(HδA+HγA) according to the color bar. The gray contours overlaid in each panel are the isodensity contours (enclosing 0.05, 0.20, 0.50, 0.75, 0.95, 0.99 of the sample) for SDSS galaxies with S/N ≥ 10 at z = 0.1 ± 0.005. Panels a–c and g display the points in the fiber-index vs. color plane, while panels d–f are in the effective radius vs. absolute magnitude plane. (a) Original difference between the index measured in the full integrated spectrum and the one in the fiber spectrum. (b) Amplitude of the first-order correction. (c) Residual difference between the index from the integrated-flux and the fiber value corrected at the first order. (d) Same as c, but in the effective radius vs. absolute magnitude plane. (e) Second-order corrections. (f) Residual difference between the index from the integrated-flux and the fiber value corrected using both the first-order and the second-order corrections. (g) Same as f, but in the fiber-index vs. color plane. The histograms in panel h display the following distributions: in filled green the original differences between integrated and fiber values (points in panel a); in dashed red the differences between integrated and fiber values corrected at the first order (points in panels c, d); in solid blue the differences between integrated and fiber values corrected at the second order (points in panels f and g). The vertical arrows on the top axis indicate the median (long arrow) and the 16th and 84th percentiles (short arrows) of the distributions of the corresponding color.
Current usage metrics show cumulative count of Article Views (full-text article views including HTML views, PDF and ePub downloads, according to the available data) and Abstracts Views on Vision4Press platform.
Data correspond to usage on the plateform after 2015. The current usage metrics is available 48-96 hours after online publication and is updated daily on week days.
Initial download of the metrics may take a while.