Fig. 6.
Download original image
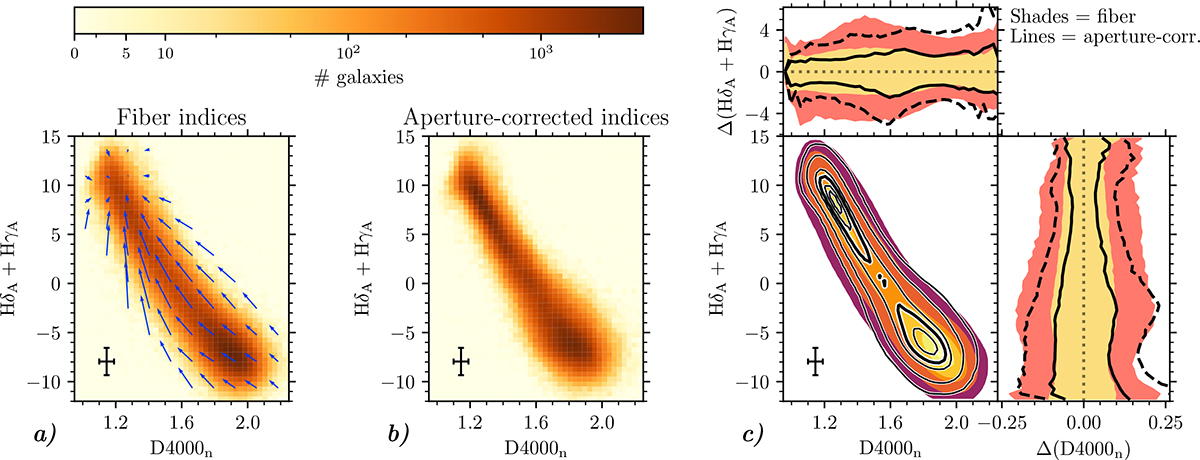
Impact of the aperture corrections of the indices on the Balmer plane HδA + HγA vs. D4000n, for the SDSS sample of galaxies with S/N ≥ 10. Panels a and b display the distributions of the galaxies before (a) and after (b) aperture corrections. The blue arrows in panel a indicate the median shift of galaxies due to the aperture corrections at different locations of the plane. The median error bars are also indicated. In panel c contour levels (shade-filled levels and line contours, for the original fiber values and for the aperture corrected values, respectively) are overlaid in order to facilitate the comparison of the two distributions. The levels correspond to quantiles at 0.05, 0.20, 0.50, 0.75, 0.95, and 0.99 of the sample distribution. The two side-panels of panel c illustrate the scatter of the distributions about the median relations. In the right-hand side panel, the 2.5, 16, 84, and 97.5 percentiles of the distribution of D4000n about its median, as a function of HδA + HγA, are represented by the shaded areas and by the different lines, for the fiber indices and for the corrected indices, respectively. The top-side panel represents the distributions of HδA + HγA about its median, as a function of D4000n.
Current usage metrics show cumulative count of Article Views (full-text article views including HTML views, PDF and ePub downloads, according to the available data) and Abstracts Views on Vision4Press platform.
Data correspond to usage on the plateform after 2015. The current usage metrics is available 48-96 hours after online publication and is updated daily on week days.
Initial download of the metrics may take a while.