Fig. 8.
Download original image
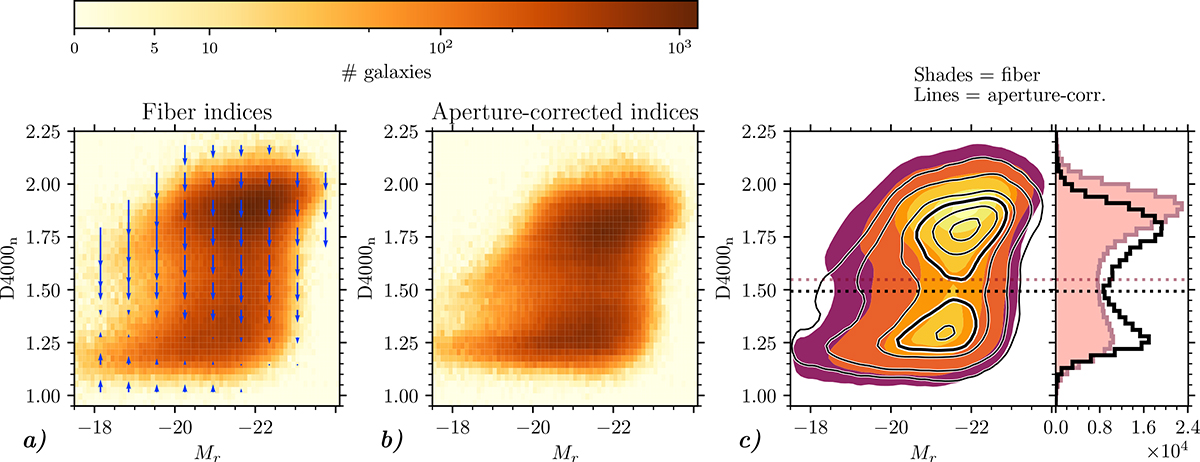
Impact of the aperture corrections of the D4000n index on the bimodality-diagnostic plane D4000n vs. absolute magnitude Mr, for the SDSS sample with S/N ≥ 10. Panels (a) and (b) and the main plot of panel (c) are analogous to Figs. 6 and 7. The side-panel of panel (c) displays the projected distributions in D4000n for the original fiber D4000n (filled pink and dark red histogram) and for the aperture-corrected D4000n (black empty histogram). The dotted horizontal lines mark the position of the minima of the two distributions, respectively.
Current usage metrics show cumulative count of Article Views (full-text article views including HTML views, PDF and ePub downloads, according to the available data) and Abstracts Views on Vision4Press platform.
Data correspond to usage on the plateform after 2015. The current usage metrics is available 48-96 hours after online publication and is updated daily on week days.
Initial download of the metrics may take a while.