Fig. 2.
Download original image
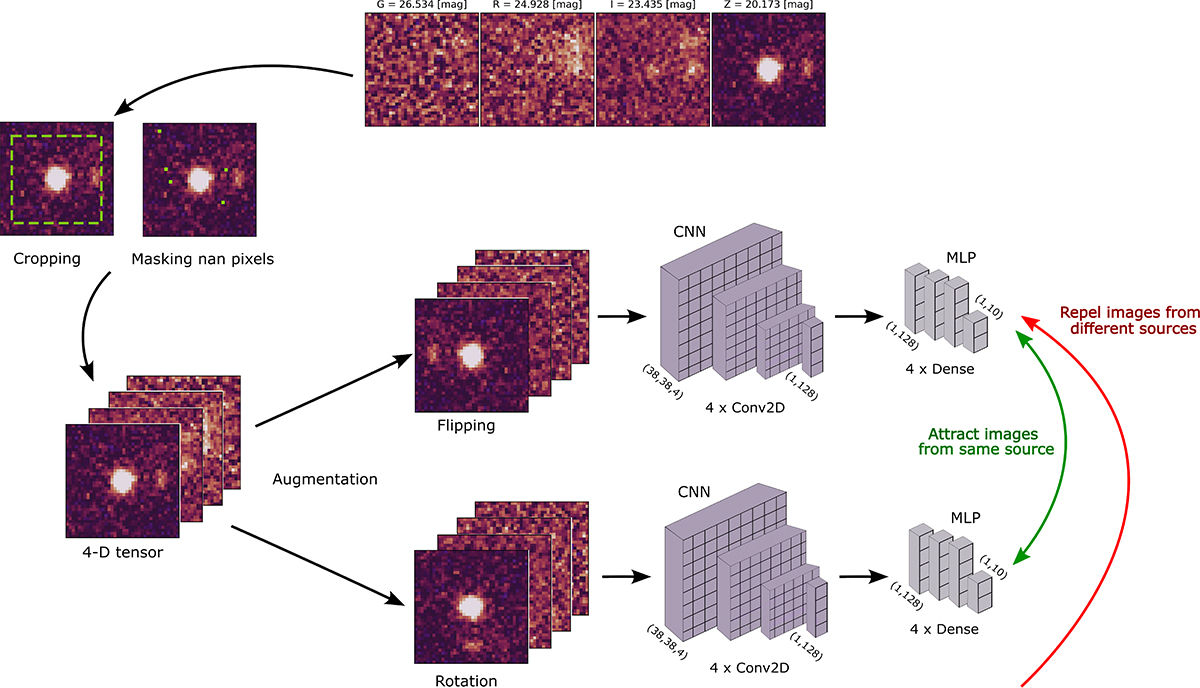
Architecture of the self-supervised CL framework used in this work. The top and left sections illustrate the image preprocessing and the tensor assembly steps. The structure of the network is shown sequentially from left to right, starting with data augmentation, then the encoder block, and lastly the projection head. Red and green arrows indicate the contrastive loss computation, which measures similarity between random pairs of augmented images.
Current usage metrics show cumulative count of Article Views (full-text article views including HTML views, PDF and ePub downloads, according to the available data) and Abstracts Views on Vision4Press platform.
Data correspond to usage on the plateform after 2015. The current usage metrics is available 48-96 hours after online publication and is updated daily on week days.
Initial download of the metrics may take a while.