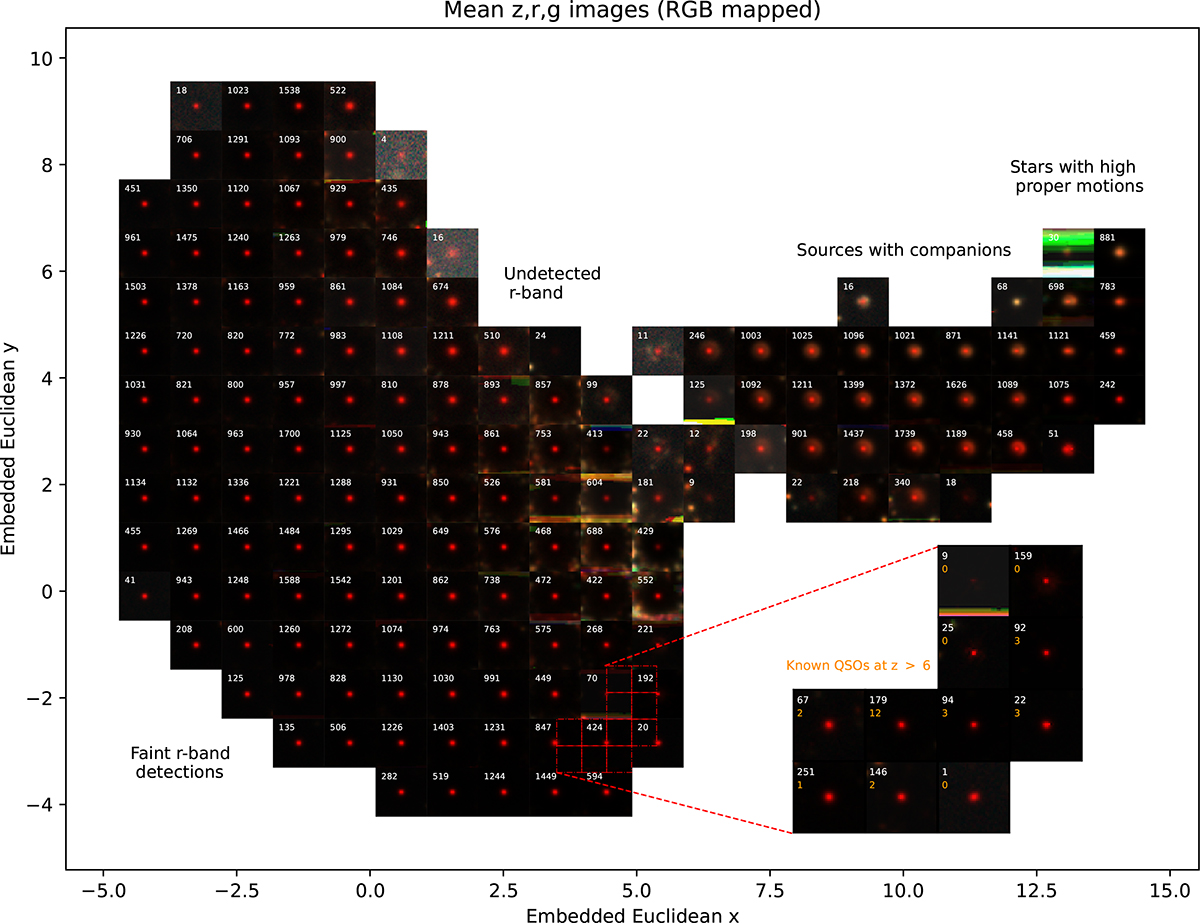
Fig. 4.
Download original image
Mean pixel-by-pixel z, r, and g band fluxes (RGB mapped) within 15 × 15 binned embedded space. The number of sources within each bin contributing to the mean is shown in white in the upper left side of each image. The red dashed lines highlight a region with the highest number of known quasars, with a zoom-in binned embedded space on the right side. The number of known quasars in each bin at the zoom-in plot is shown in orange, below the number of sources in white.
Current usage metrics show cumulative count of Article Views (full-text article views including HTML views, PDF and ePub downloads, according to the available data) and Abstracts Views on Vision4Press platform.
Data correspond to usage on the plateform after 2015. The current usage metrics is available 48-96 hours after online publication and is updated daily on week days.
Initial download of the metrics may take a while.