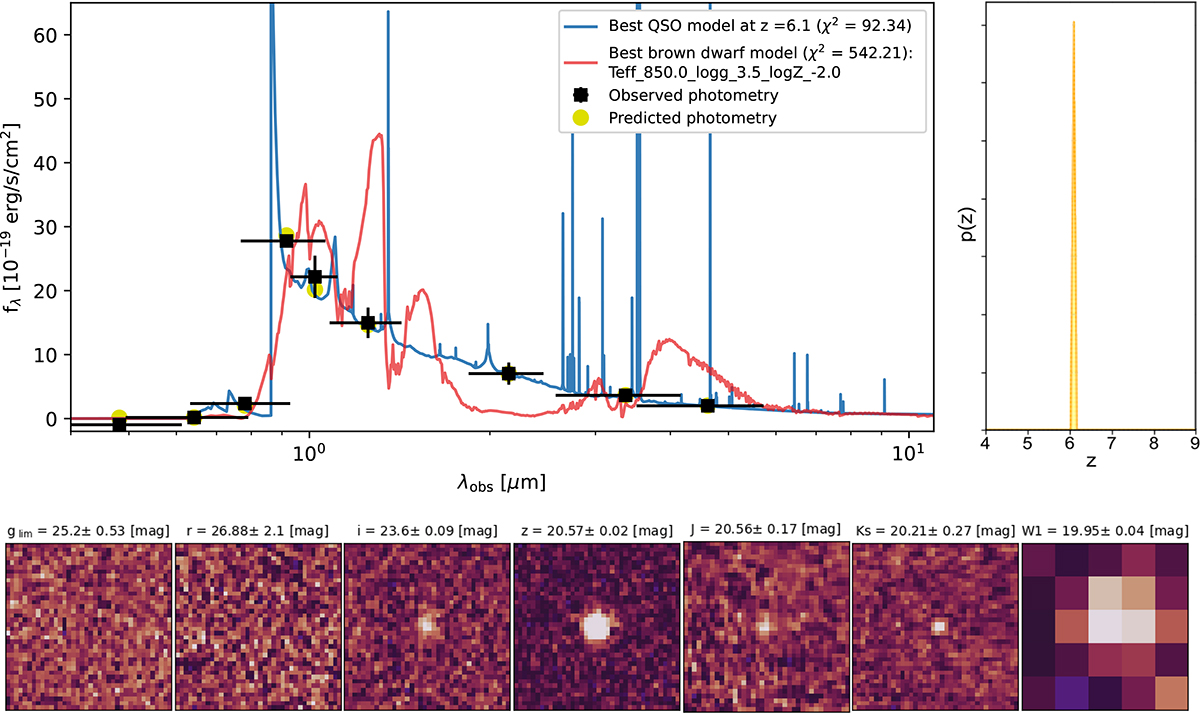
Fig. 5.
Download original image
Example of an SED fitting result and the photometric redshift probability distribution function (top panels). LS DR10, VHS DR7, and WISE postage stamps of the photometry used (bottom panel) for the source LS J000−79. Top left: blue curve represents the best-fit model given by the QSO1 template (see Salvato et al. 2022 for details) at redshift 6.096, while the red curve shows the best-fit brown dwarf template from Meisner et al. (2021). The observed photometry represented by black squares with error bars corresponds to the DECam, VHS, and WISE catalogs and their uncertainties, while the yellow circles are the expected flux densities assuming the best quasar model. Top right: photometric redshift probability distribution function. Despite the distribution extending over z = [0, 12], we limited the plot to the range z = [4, 9] for better visualization.
Current usage metrics show cumulative count of Article Views (full-text article views including HTML views, PDF and ePub downloads, according to the available data) and Abstracts Views on Vision4Press platform.
Data correspond to usage on the plateform after 2015. The current usage metrics is available 48-96 hours after online publication and is updated daily on week days.
Initial download of the metrics may take a while.