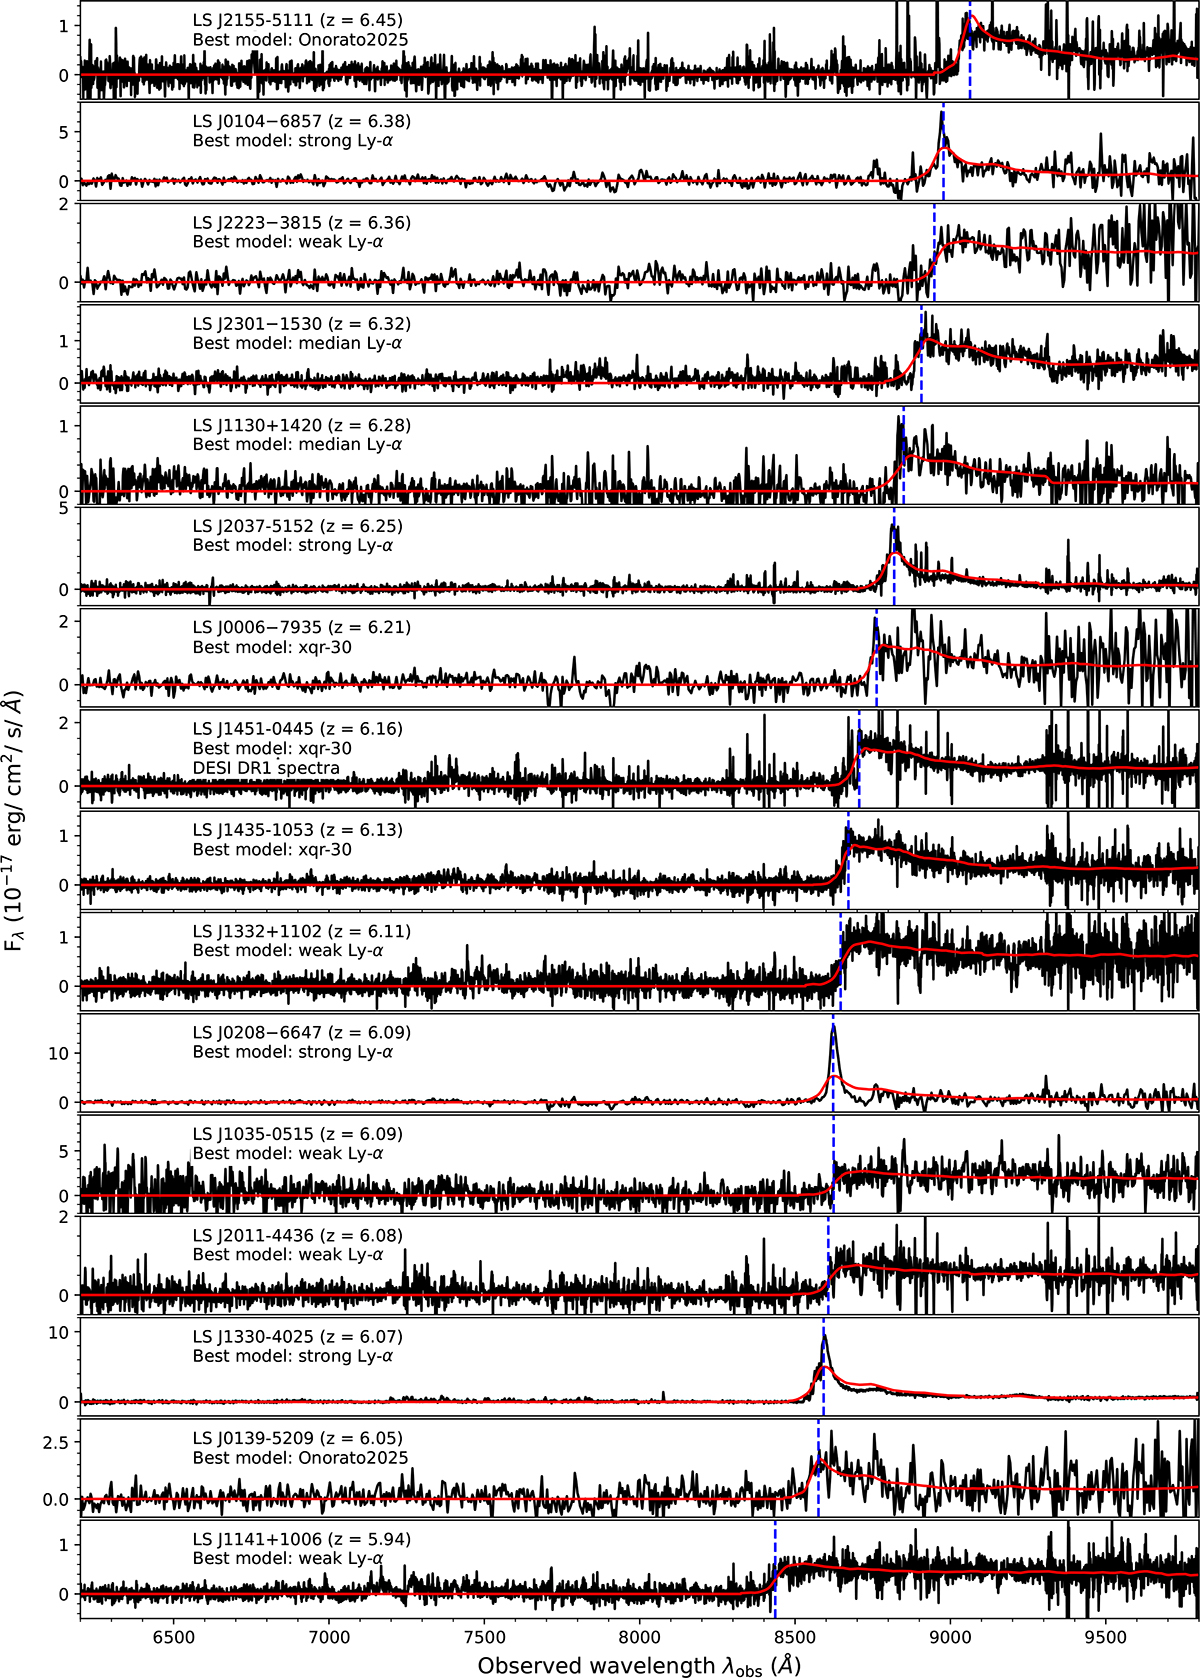
Fig. 6.
Download original image
Optical discovery spectra of the 16 new quasars reported in this work, including the quasar LS J1451−0445 from the DESI data release (Abdul-Karim et al. 2025). The black curves show the observed spectra, the red curves the best-fit quasar templates used for redshift estimation, and blue dashed lines indicate the adopted best-fit position of Ly-α. Each panel lists the source name, spectroscopic redshift, and the best-fit template in the upper left corner. The typical redshift uncertainty is 0.03 (see Section 5). Quasars are sorted from top to bottom by decreasing redshift.
Current usage metrics show cumulative count of Article Views (full-text article views including HTML views, PDF and ePub downloads, according to the available data) and Abstracts Views on Vision4Press platform.
Data correspond to usage on the plateform after 2015. The current usage metrics is available 48-96 hours after online publication and is updated daily on week days.
Initial download of the metrics may take a while.