Fig. 7.
Download original image
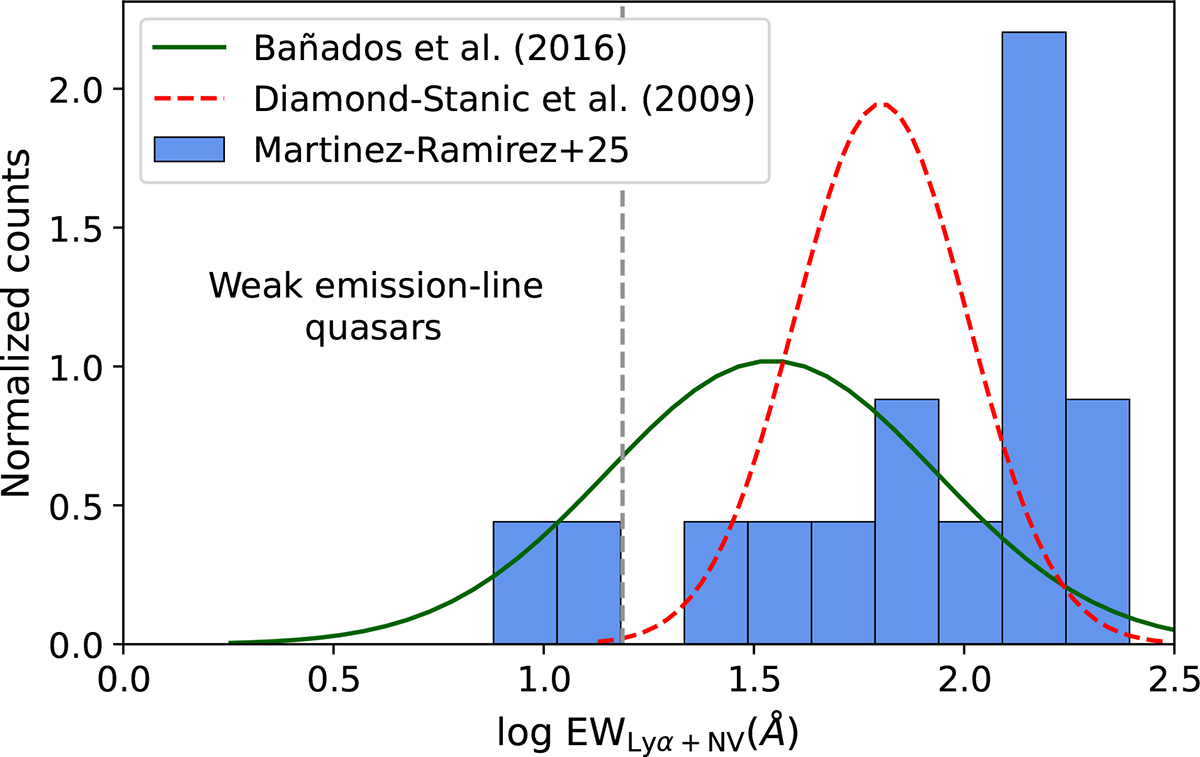
Normalized EW(Ly[[INLINE491]] + N V) distribution for the 16 quasars at z = 5.93 − 6.45 identified through our CL selection. The solid green and dashed red curves show the best-fit log-normal distributions for PS1 quasars (Bañados et al. 2016) and SDSS quasars (Diamond-Stanic et al. 2009), with mean values of log(EW/Å) = 1.542 and 1.803, and standard deviations of 0.391 and 0.205 Å, respectively. The vertical dashed gray line marks the limit for WLQs (EW < 15.4 Å; Diamond-Stanic et al. 2009). While most of our sample overlaps with the PS1 distribution at log(EW/Å) < 2, a substantial excess appears in the high-EW tail, potentially revealing a distinct population of strong-line quasars.
Current usage metrics show cumulative count of Article Views (full-text article views including HTML views, PDF and ePub downloads, according to the available data) and Abstracts Views on Vision4Press platform.
Data correspond to usage on the plateform after 2015. The current usage metrics is available 48-96 hours after online publication and is updated daily on week days.
Initial download of the metrics may take a while.