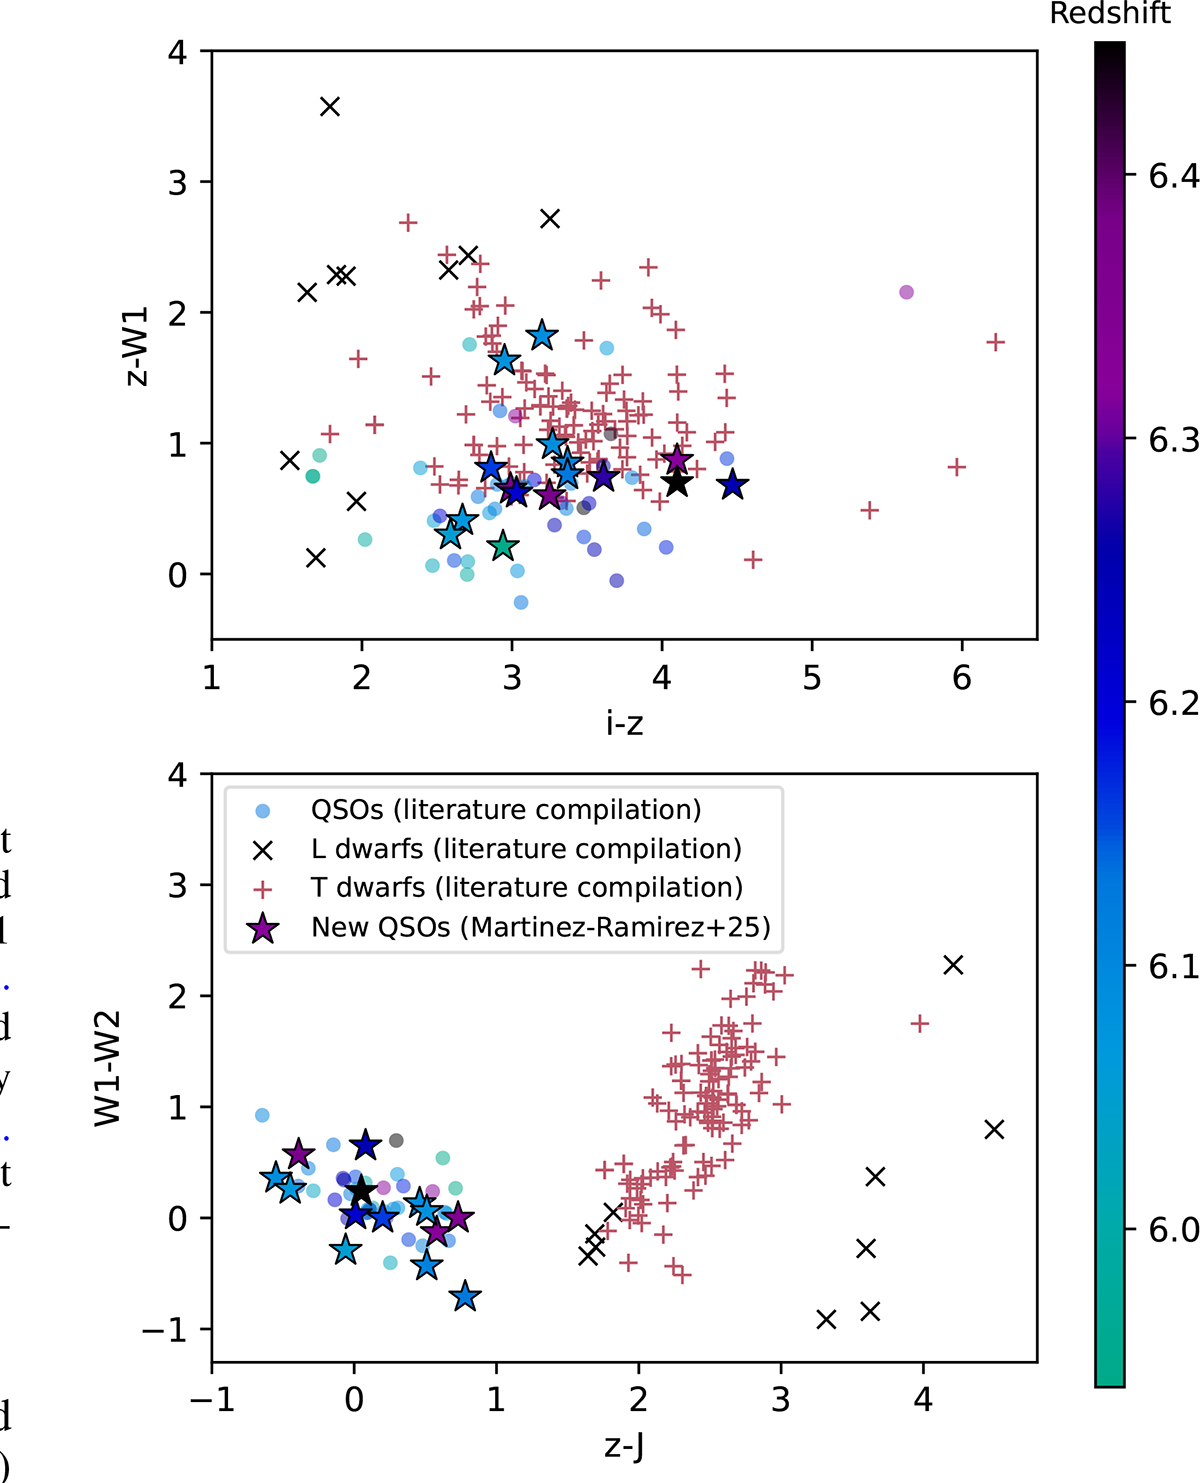
Fig. 8.
Download original image
Color–color diagrams showing the positions of the newly discovered quasars (stars) and the known high-redshift quasars at the same redshift range of our discoveries 5.94 ≤ z ≤ 6.45 (filled circles), both color-coded by redshift; and L and T dwarfs (black and red crosses, respectively) used as labels in the embedded space. Top: i − z vs. z − W1. Bottom: z − J vs. W1 − W2. While i − z vs. z − W1 shows a total overlap of the new quasars with the T dwarf population, the z − J color shows a clear distinction.
Current usage metrics show cumulative count of Article Views (full-text article views including HTML views, PDF and ePub downloads, according to the available data) and Abstracts Views on Vision4Press platform.
Data correspond to usage on the plateform after 2015. The current usage metrics is available 48-96 hours after online publication and is updated daily on week days.
Initial download of the metrics may take a while.