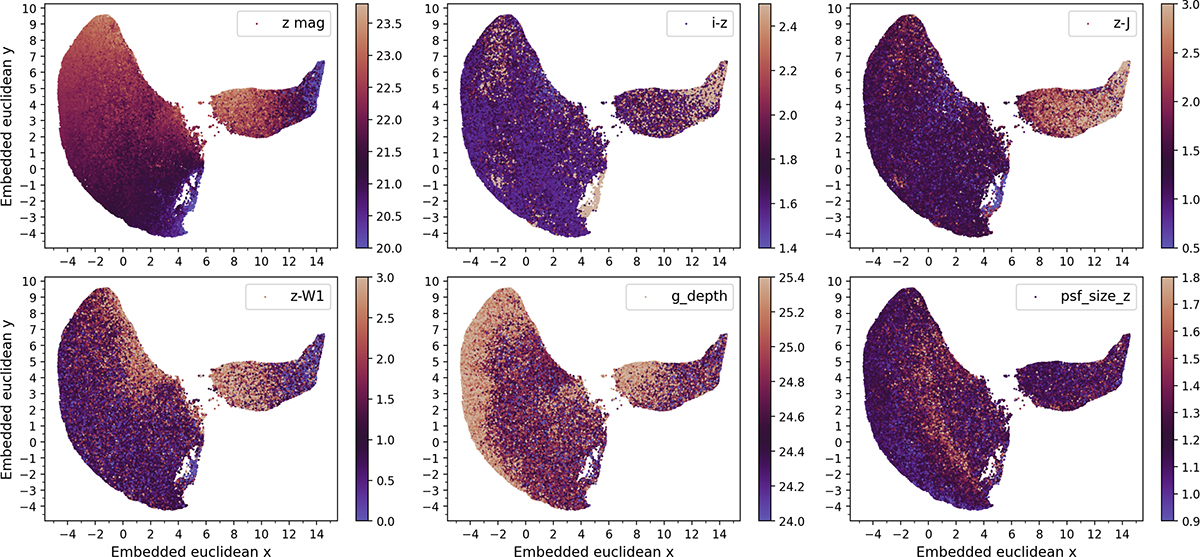
Fig. A.1.
Download original image
Color-coded embedded space maps showing catalog photometric features. Top row (left to right): z-band magnitude, i − z color, and z − J color. Bottom row: z-W1 color, g-band depth, and z-band PSF size. Top left: magnitude gradients across both regions underscore the crucial role of the brightness in shaping the low-dimensional representation. Top center: Multiple regions of strong i − z color indicate that while this feature may not fully dominate the embedding, it still plays a key role–evidenced by patterns and some clustering that overlap with the positions of spectroscopically confirmed quasars. Top right: The z − J color map reveals populations consistent with blue quasars (z − J ≤ 0.5), quasars with intermediate colors (z − J ∼ 1.0–1.5), and a population with red NIR slopes (z − J > 2), supporting the potential of the model to uncover diverse quasar types. Bottom left: Red z-W1 colors seem to reflect the W1 blending due to companions and potential faint T dwarf populations. Bottom center: Subtle observational systematics, such as variations in background noise texture, may influence the latent space structure as evidenced by the g-band depth pattern. Bottom right: Larger PSFs point to a mix of slightly extended or noisy z-band images.
Current usage metrics show cumulative count of Article Views (full-text article views including HTML views, PDF and ePub downloads, according to the available data) and Abstracts Views on Vision4Press platform.
Data correspond to usage on the plateform after 2015. The current usage metrics is available 48-96 hours after online publication and is updated daily on week days.
Initial download of the metrics may take a while.