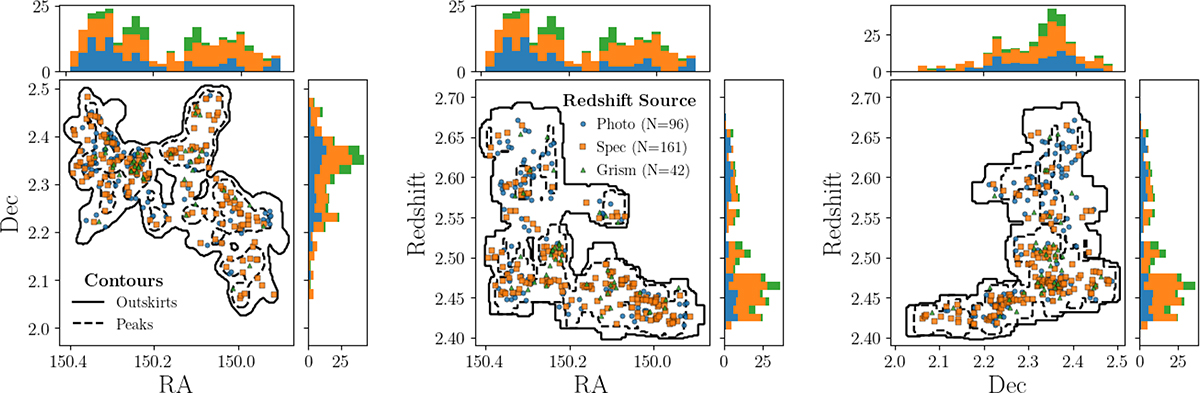
Fig. A.1.
Download original image
The distribution of Hyperion member galaxies, projected in the (left) R.A.-Dec., (middle) R.A.-z, and (right) Dec.-z planes. In each panel, the solid and dashed contours correspond to Hyperion’s outskirts and peaks, respectively, as defined by the VMC overdensity map. Additionally, the locations of the member galaxies are plotted prior to any Monte Carlo redshift sampling, and their marks are distinguished according to the redshift source: COSMOS2020 photometry (blue circles), ground-based spectroscopy (orange squares), or HST/grism spectroscopy (green triangles). For galaxies with both a ground-based spectroscopic redshift and a HST/grism redshift, the redshift with the highest quality according to the quality flags discussed in Section 2 is chosen. The histograms along each axis show the distribution of member galaxies in the corresponding projected dimension, color-coded by redshift source.
Current usage metrics show cumulative count of Article Views (full-text article views including HTML views, PDF and ePub downloads, according to the available data) and Abstracts Views on Vision4Press platform.
Data correspond to usage on the plateform after 2015. The current usage metrics is available 48-96 hours after online publication and is updated daily on week days.
Initial download of the metrics may take a while.