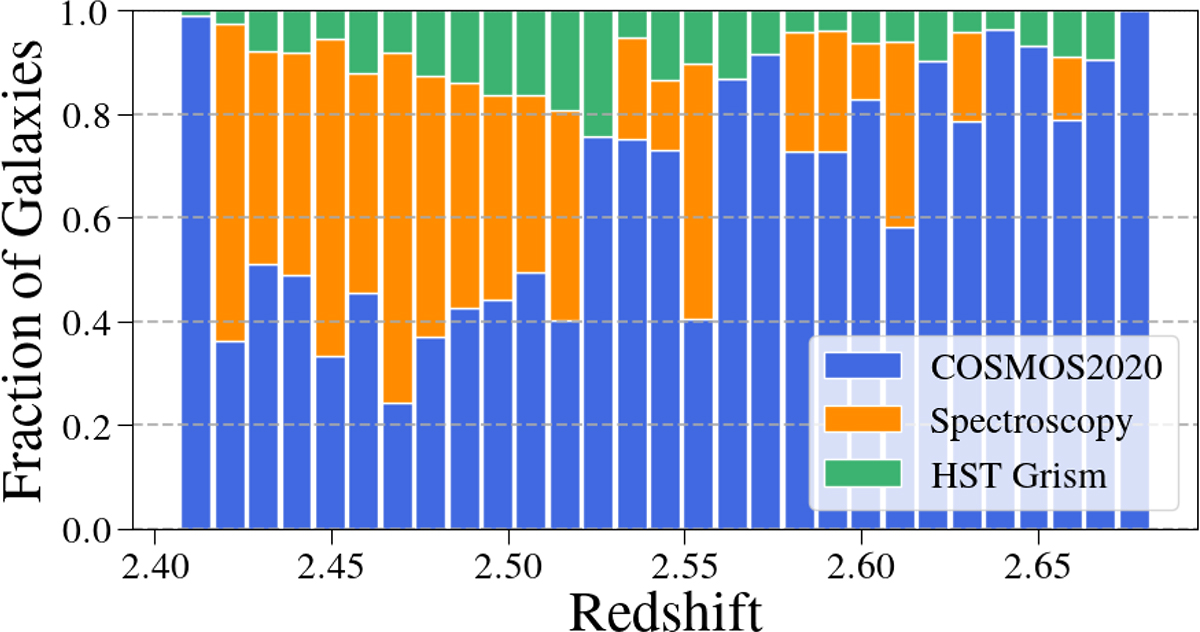
Fig. A.2.
Download original image
We show, as a function of redshift, the fraction of galaxies within Hyperion across all 100 MC iterations with redshifts determined from photometry (blue), ground-based spectroscopy (orange), and HST-grism spectroscopy (green). The lower-redshift portion of Hyperion is dominated by spectroscopic redshifts, whereas the higher-redshift portion is dominated by photometric redshifts.
Current usage metrics show cumulative count of Article Views (full-text article views including HTML views, PDF and ePub downloads, according to the available data) and Abstracts Views on Vision4Press platform.
Data correspond to usage on the plateform after 2015. The current usage metrics is available 48-96 hours after online publication and is updated daily on week days.
Initial download of the metrics may take a while.