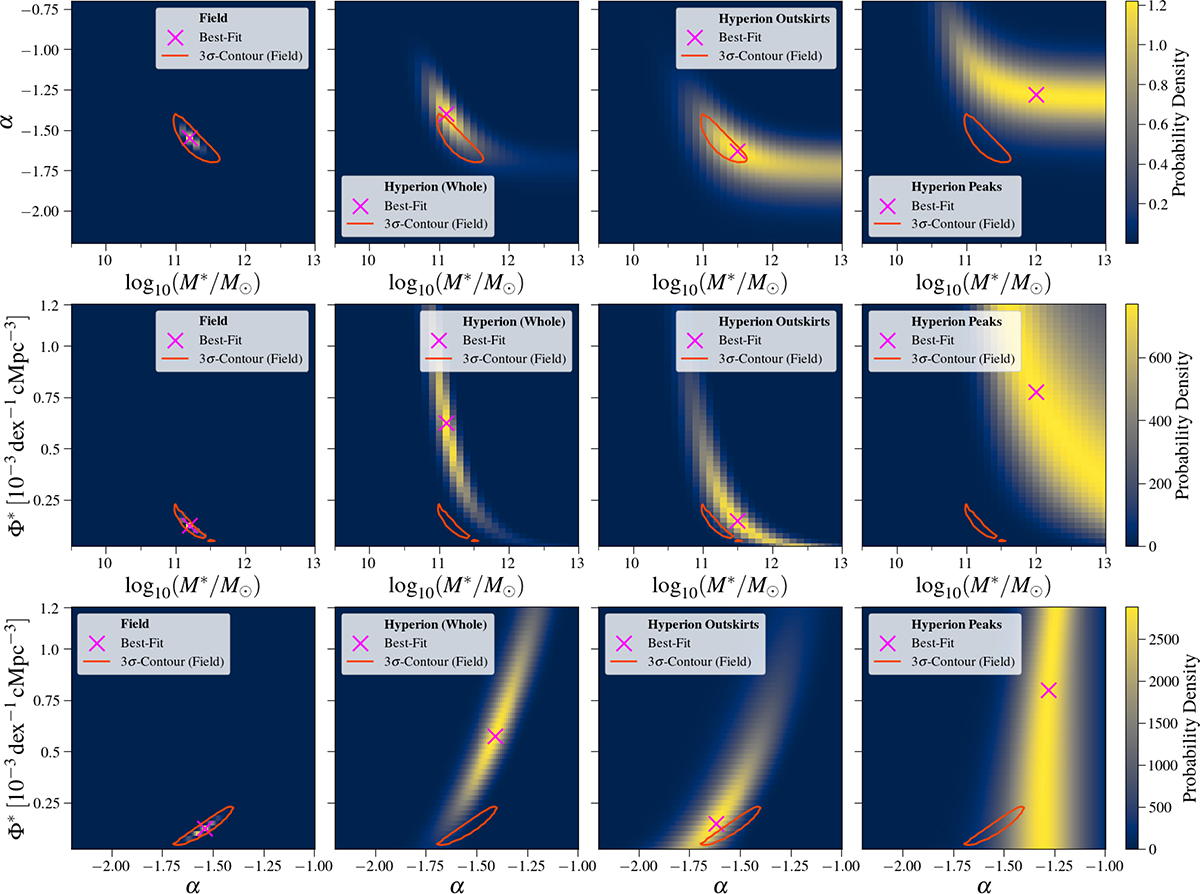
Fig. B.1.
Download original image
To explore the degeneracies of the parameters in the single-Schechter functions, we plot the parameter spaces of the fits to the SMFs of (Columns 1-4) the field, Hyperion as a whole, Hyperion’s outskirts, and Hyperion’s peaks. In each row, we fit over a grid of two of the three parameters in the single-Schechter function, and marginalize over the remaining parameter to minimize the χ2 value. The parameter spaces explored are (row 1) log10M* − α, (row 2) log10M* − Φ*, and (row 3) α − Φ*. For each subplot, we plot the point with the minimum χ2 value in the given parameter space (magenta X). In each row, we additionally plot a 3σ contour from the field, corresponding to Δχ2 ≃ 11.8, to make comparisons between the likelihood surfaces from the field and the other populations in each column easier.
Current usage metrics show cumulative count of Article Views (full-text article views including HTML views, PDF and ePub downloads, according to the available data) and Abstracts Views on Vision4Press platform.
Data correspond to usage on the plateform after 2015. The current usage metrics is available 48-96 hours after online publication and is updated daily on week days.
Initial download of the metrics may take a while.