Fig. C.1.
Download original image
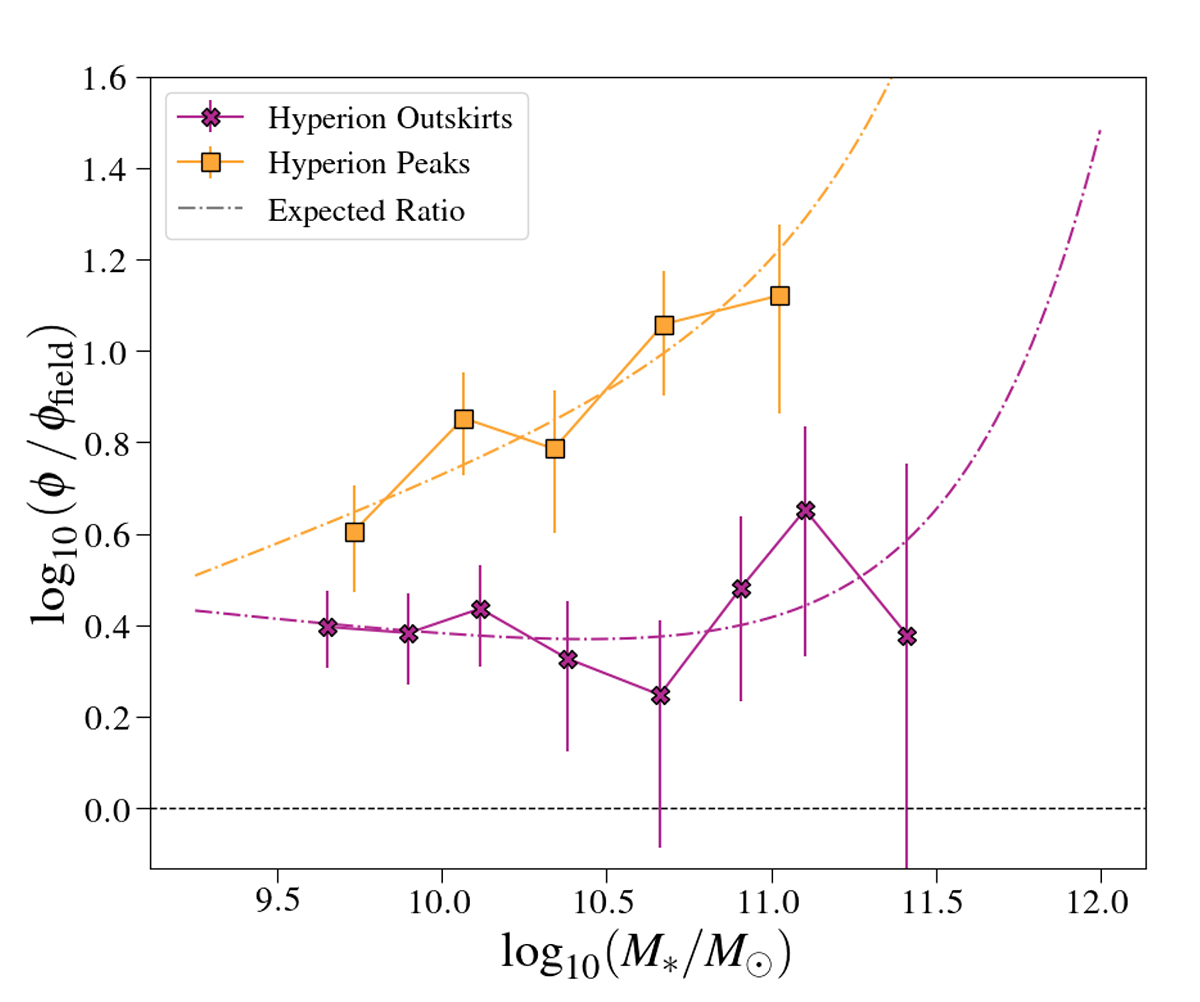
The SMFs of the Hyperion outskirts (magenta) and peaks (orange) after being normalized by the coeval field. The points are identical to those shown in Figure 9. The lines are the expected forms of the ratios using the best-fit parameters for the single-Schechter functions. For most the stellar mass range considered in this work, the ratio is expected to be nearly linear in log-log space.
Current usage metrics show cumulative count of Article Views (full-text article views including HTML views, PDF and ePub downloads, according to the available data) and Abstracts Views on Vision4Press platform.
Data correspond to usage on the plateform after 2015. The current usage metrics is available 48-96 hours after online publication and is updated daily on week days.
Initial download of the metrics may take a while.