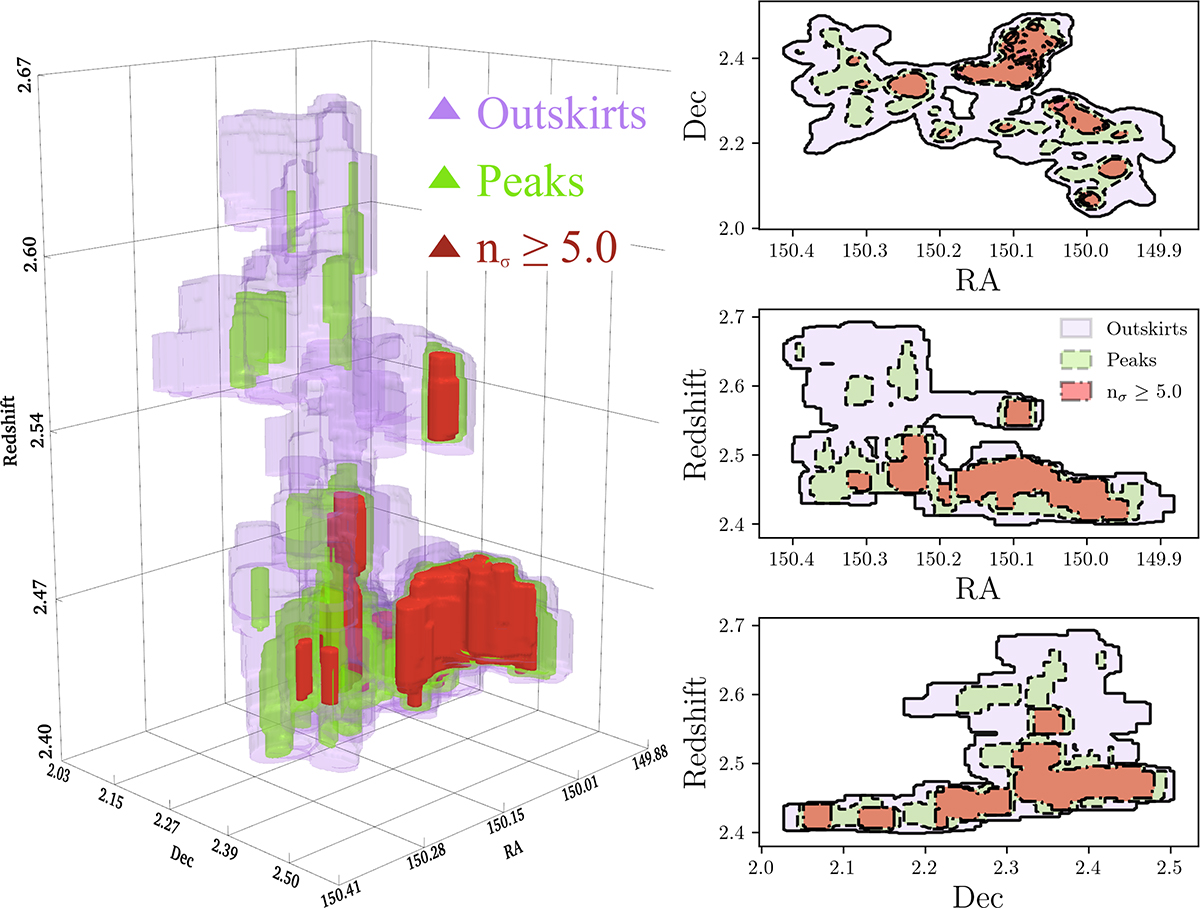
Fig. 3.
Download original image
Left: 3D rendering of Hyperion, as defined by the VMC technique. Right: 2D projections of Hyperion in the (top) R.A.-Dec., (middle) R.A.-z, and (bottom) Dec.-z planes. In all panels, the contours delineate regions of differing overdensity within the VMC map. The purple and green shaded regions correspond to Hyperion’s outskirts (2.5 ≤ nσ ≤ 4.0) and peaks (nσ ≥ 4.0), respectively, where nσ is defined in Equation (2). Also shown in red are regions with nσ ≥ 5.0, which generally trace the most massive peaks of Hyperion (detailed in Table A.1).
Current usage metrics show cumulative count of Article Views (full-text article views including HTML views, PDF and ePub downloads, according to the available data) and Abstracts Views on Vision4Press platform.
Data correspond to usage on the plateform after 2015. The current usage metrics is available 48-96 hours after online publication and is updated daily on week days.
Initial download of the metrics may take a while.