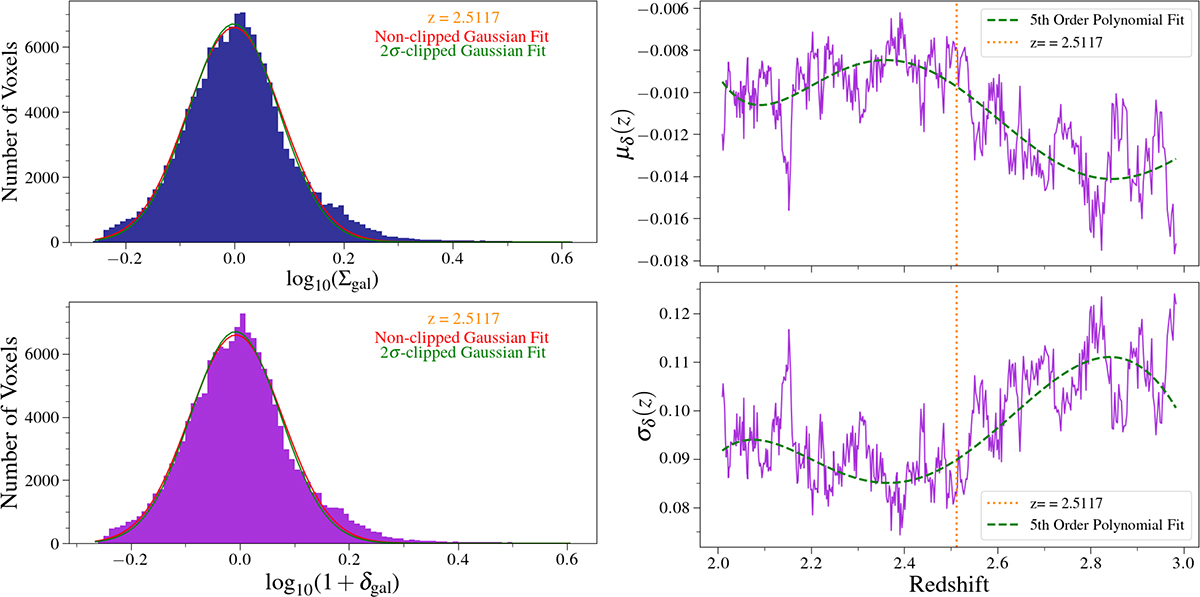
Fig. 4.
Download original image
Left: Distributions (with median set to zero) of log-density (top), and local overdensity (bottom) for all of the voxels in the redshift bin centered on z ∼ 2.51. The Gaussian and 2σ clipped Gaussian (red and green, respectively) are fit over both distributions. Right: Distribution of the mean overdensity (top) and standard deviation of overdensity (bottom) as a function of redshift. The functions are fit with a fifth-order polynomial (green line) in order to smooth over small fluctuations in redshift space.
Current usage metrics show cumulative count of Article Views (full-text article views including HTML views, PDF and ePub downloads, according to the available data) and Abstracts Views on Vision4Press platform.
Data correspond to usage on the plateform after 2015. The current usage metrics is available 48-96 hours after online publication and is updated daily on week days.
Initial download of the metrics may take a while.