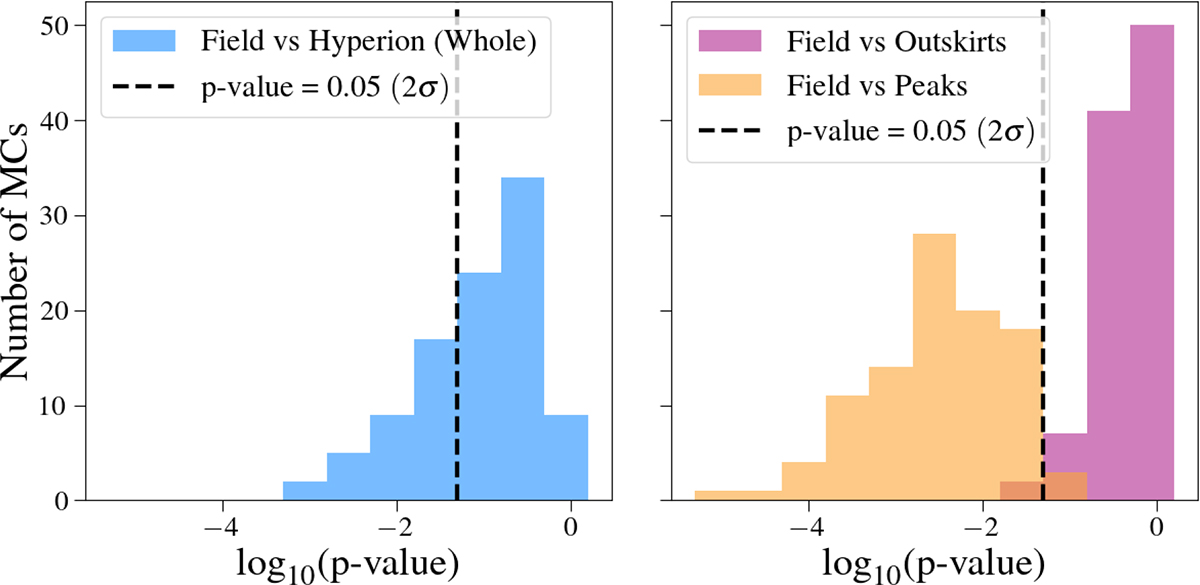
Fig. 7.
Download original image
The results of two sample KS tests that were run for each of the 100 MC realizations in which we compare the mass distribution of the field to that of (left) Hyperion as a whole and (right) Hyperion’s outskirts (pink) and overdensity peaks (orange). We find 33% of MCs in which Hyperion as a whole is statistically different from that of the field (p < 0.05), compared to 2% and 97% for the Hyperion outskirts and peaks, respectively. Thus, the underlying mass distribution for Hyperion’s peaks are significantly different from the field for most of the MC realizations, compared to Hyperion’s outskirts, which show no significant difference.
Current usage metrics show cumulative count of Article Views (full-text article views including HTML views, PDF and ePub downloads, according to the available data) and Abstracts Views on Vision4Press platform.
Data correspond to usage on the plateform after 2015. The current usage metrics is available 48-96 hours after online publication and is updated daily on week days.
Initial download of the metrics may take a while.