Fig. 9.
Download original image
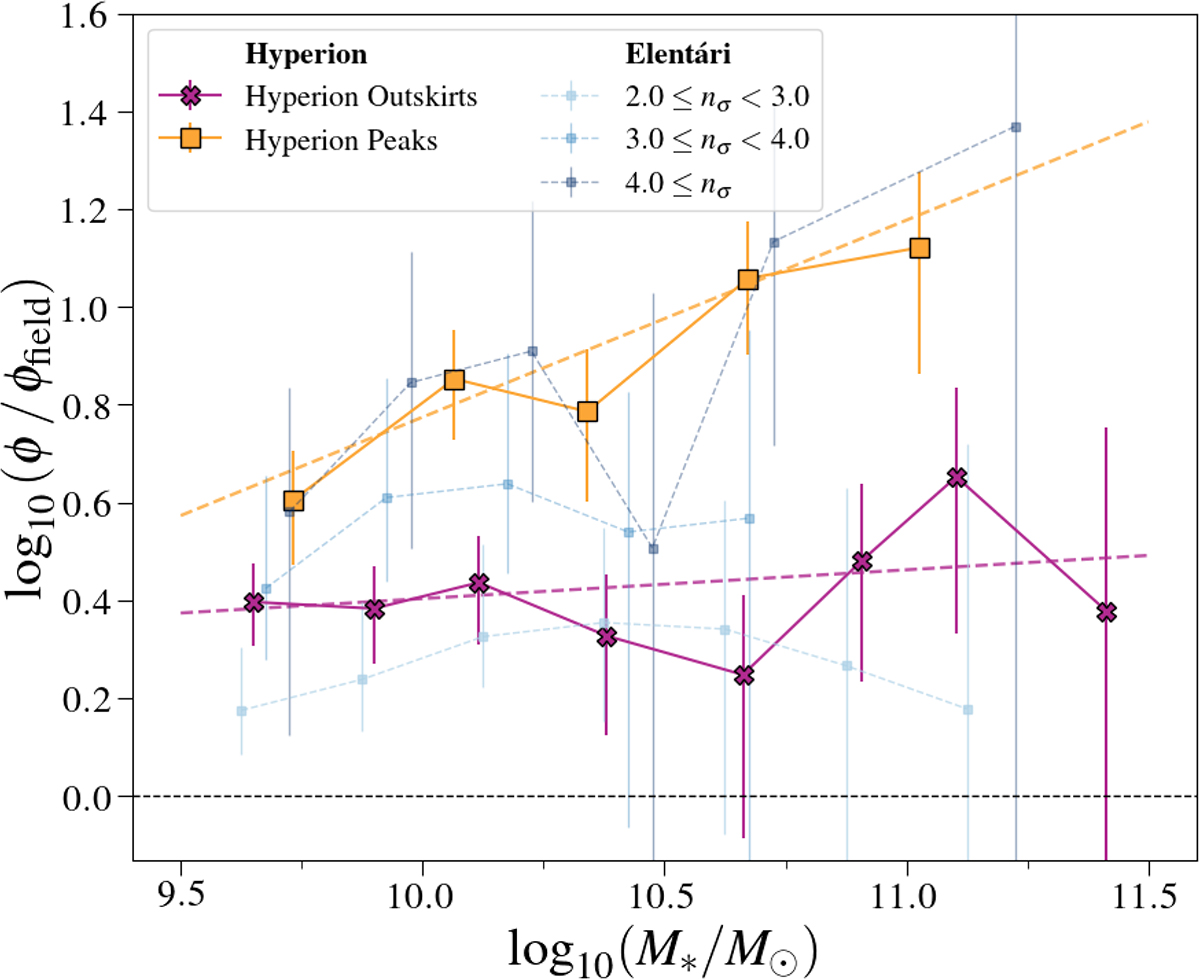
The SMFs of the Hyperion outskirts (magenta) and peaks (orange) after being normalized by the coeval field, and linear fits to both sets assuming log10(ϕ/ϕfield) = βlog10(M*)+log10(A). We additionally show the results from the Elentàri proto-supercluster at z ∼ 3.3 (Forrest et al. 2024b). In this framework, a flat line corresponds to an SMF in an overdense region with an identical shape to the coeval field, whereas a positive slope corresponds to an overdense region with a larger fraction of higher- to lower-mass galaxies.
Current usage metrics show cumulative count of Article Views (full-text article views including HTML views, PDF and ePub downloads, according to the available data) and Abstracts Views on Vision4Press platform.
Data correspond to usage on the plateform after 2015. The current usage metrics is available 48-96 hours after online publication and is updated daily on week days.
Initial download of the metrics may take a while.