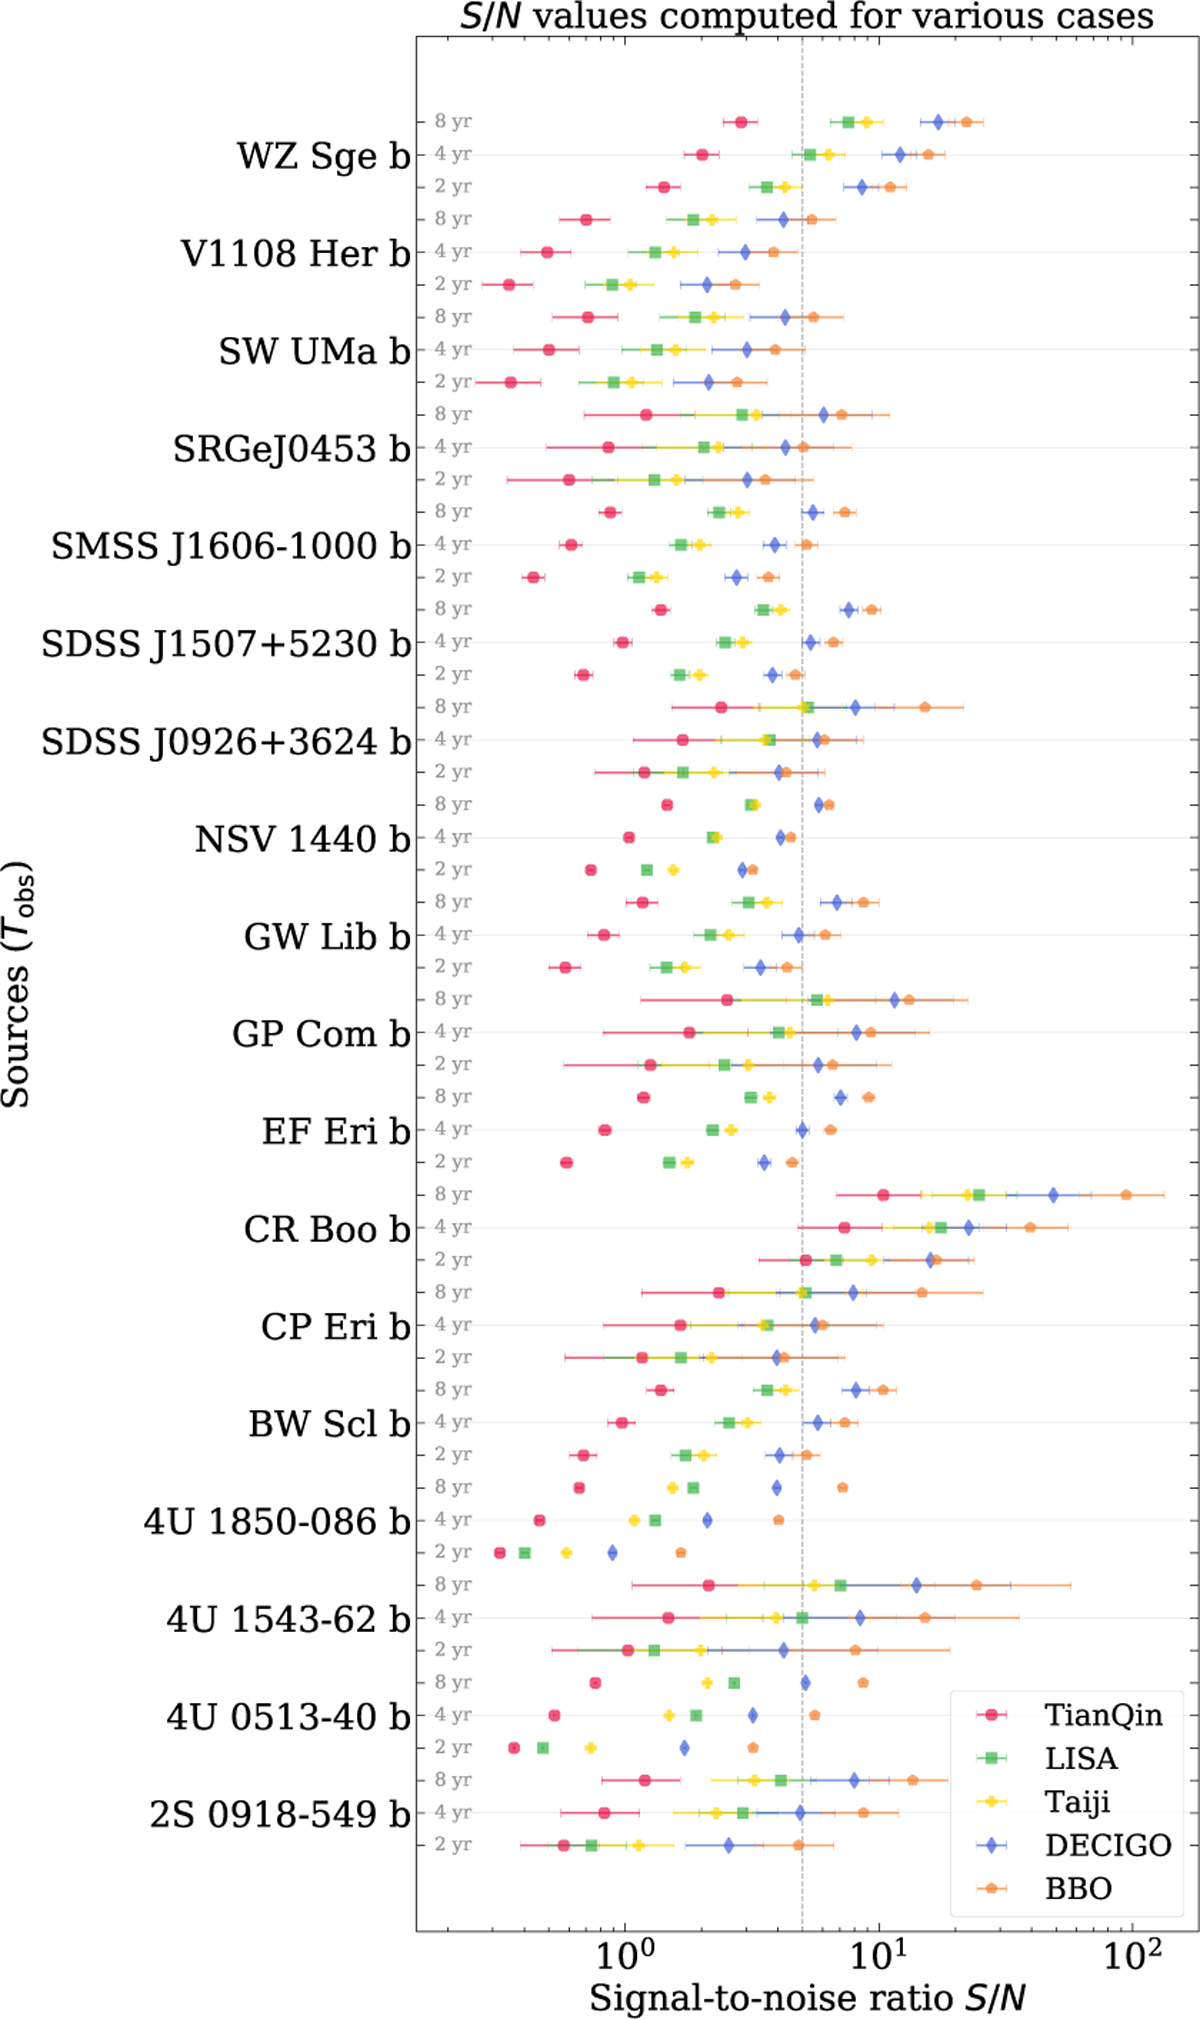
Fig. 2
Download original image
S/N values of the promising sources for various detectors and observation durations. The circles, squares, filled pluses, rhombuses, and pentagons represent the TianQin, LISA, Taiji, DECIGO, and BBO results, respectively. The data points situated on the horizontal gray line corresponding to each source signify the S/N values calculated for Tobs = 4 yr. The S/N values calculated for Tobs = 2 yr and Tobs = 8 yr are shown in the lower and upper sides of the horizontal gray line, respectively. The vertical dashed gray line denotes S/Nthr = 5. Sources with S/N ≳ S/Nthr are regarded as detectable. Sources with S/N ≥ 1 indicate that the GW signals lie above the sensitivity curves of the corresponding detectors.
Current usage metrics show cumulative count of Article Views (full-text article views including HTML views, PDF and ePub downloads, according to the available data) and Abstracts Views on Vision4Press platform.
Data correspond to usage on the plateform after 2015. The current usage metrics is available 48-96 hours after online publication and is updated daily on week days.
Initial download of the metrics may take a while.