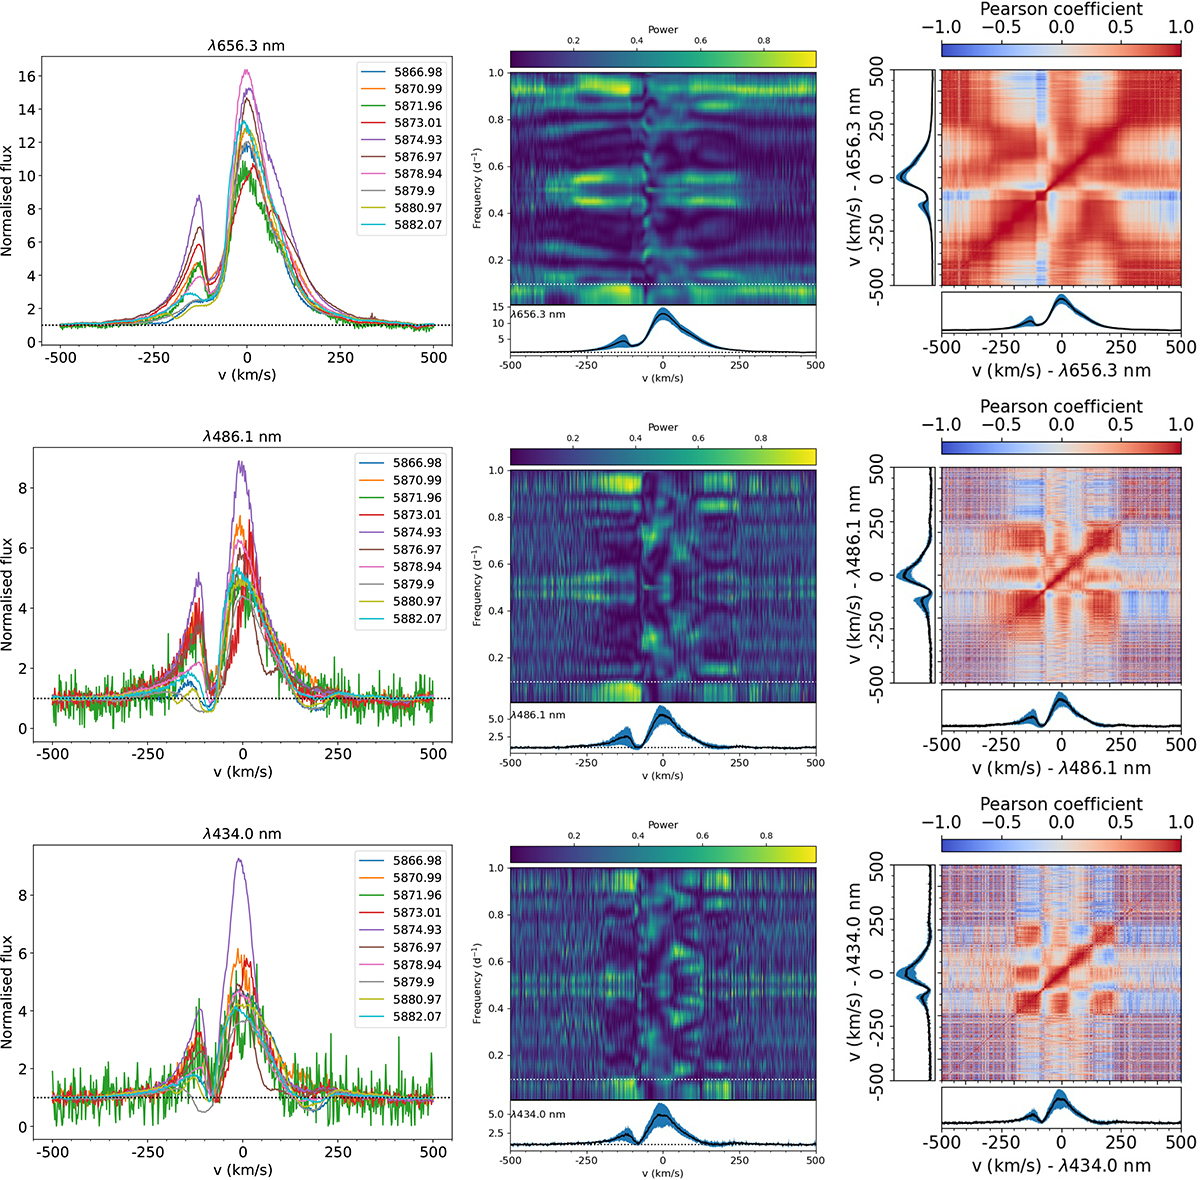
Fig. 1.
Download original image
Variability analysis of Balmer lines. The Hα, Hβ, and Hγ lines are depicted on the first, second, and third line, respectively. The first column shows the line profiles, each colour corresponding to an observation. The second column shows the P2Ds, with the velocity on the x-axis, the frequency on the y-axis, and the power of the periodogram scaled by the colour bar. The white dotted line shows the primary rotation period of 10.5 days derived by Allen et al. (2017). The mean profile and its variance are shown in black and blue, respectively, along the x-axis of the P2D. The third column presents the ACMs. The two velocity lines are on the x- and y-axes. The colour bar is scaled to the Pearson correlation coefficient: 1 means highly correlated (red) and −1 is highly anticorrelated (blue). The two mean and variance profiles are illustrated in black and blue, respectively, along its corresponding axis.
Current usage metrics show cumulative count of Article Views (full-text article views including HTML views, PDF and ePub downloads, according to the available data) and Abstracts Views on Vision4Press platform.
Data correspond to usage on the plateform after 2015. The current usage metrics is available 48-96 hours after online publication and is updated daily on week days.
Initial download of the metrics may take a while.