Open Access
Fig. B.2.
Download original image
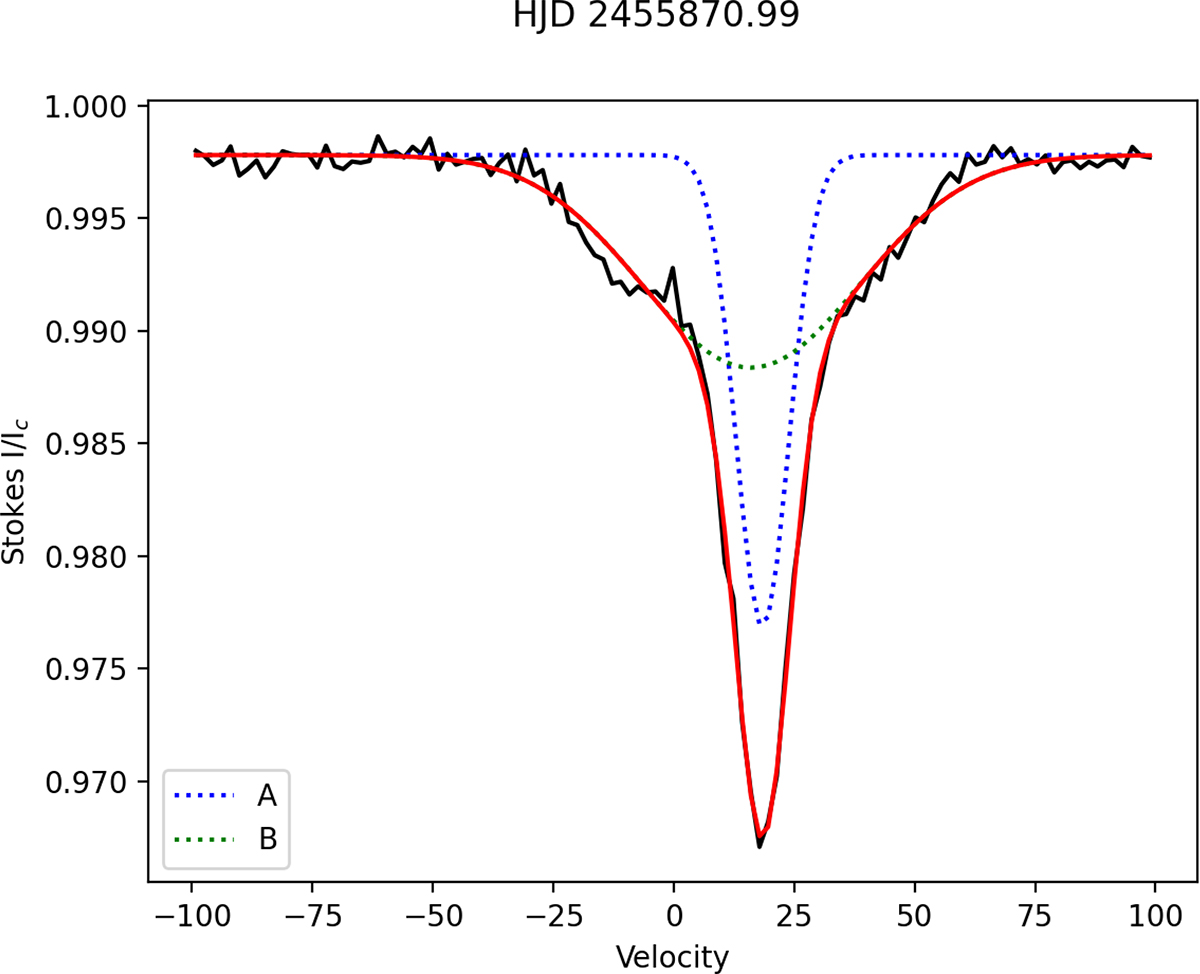
Example of the decomposition of the LDS profile at HJD 2 455 870.99. The observation is in black, the dotted blue and green lines are the A and B components, respectively. The red line is the total fit.
Current usage metrics show cumulative count of Article Views (full-text article views including HTML views, PDF and ePub downloads, according to the available data) and Abstracts Views on Vision4Press platform.
Data correspond to usage on the plateform after 2015. The current usage metrics is available 48-96 hours after online publication and is updated daily on week days.
Initial download of the metrics may take a while.