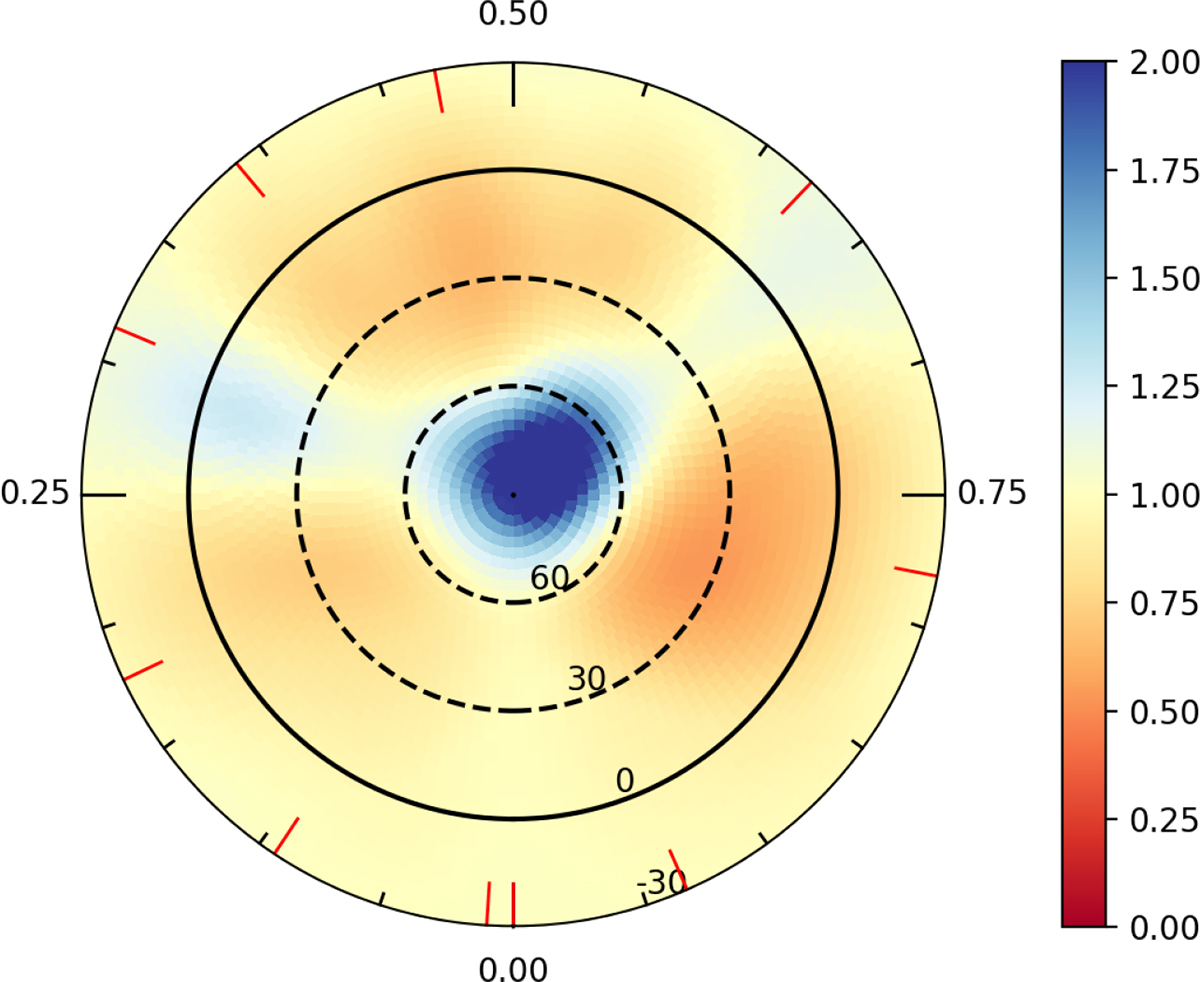
Fig. 5.
Download original image
Doppler image (brightness maps) of DF Tau on a flattened polar view. The central dot illustrates the rotation pole, the two dotted circles are latitude 60° and 30°, and the solid circle represents the equator. The black ticks show the clockwise rotation phases, and the red ticks represent the observed phases. The colour-coding indicates the brightness on a linear scale, where a value of 1 represents the quiet photosphere. Values lower than one are darker regions, and values greater than one are bright.
Current usage metrics show cumulative count of Article Views (full-text article views including HTML views, PDF and ePub downloads, according to the available data) and Abstracts Views on Vision4Press platform.
Data correspond to usage on the plateform after 2015. The current usage metrics is available 48-96 hours after online publication and is updated daily on week days.
Initial download of the metrics may take a while.