Fig. A.1.
Download original image
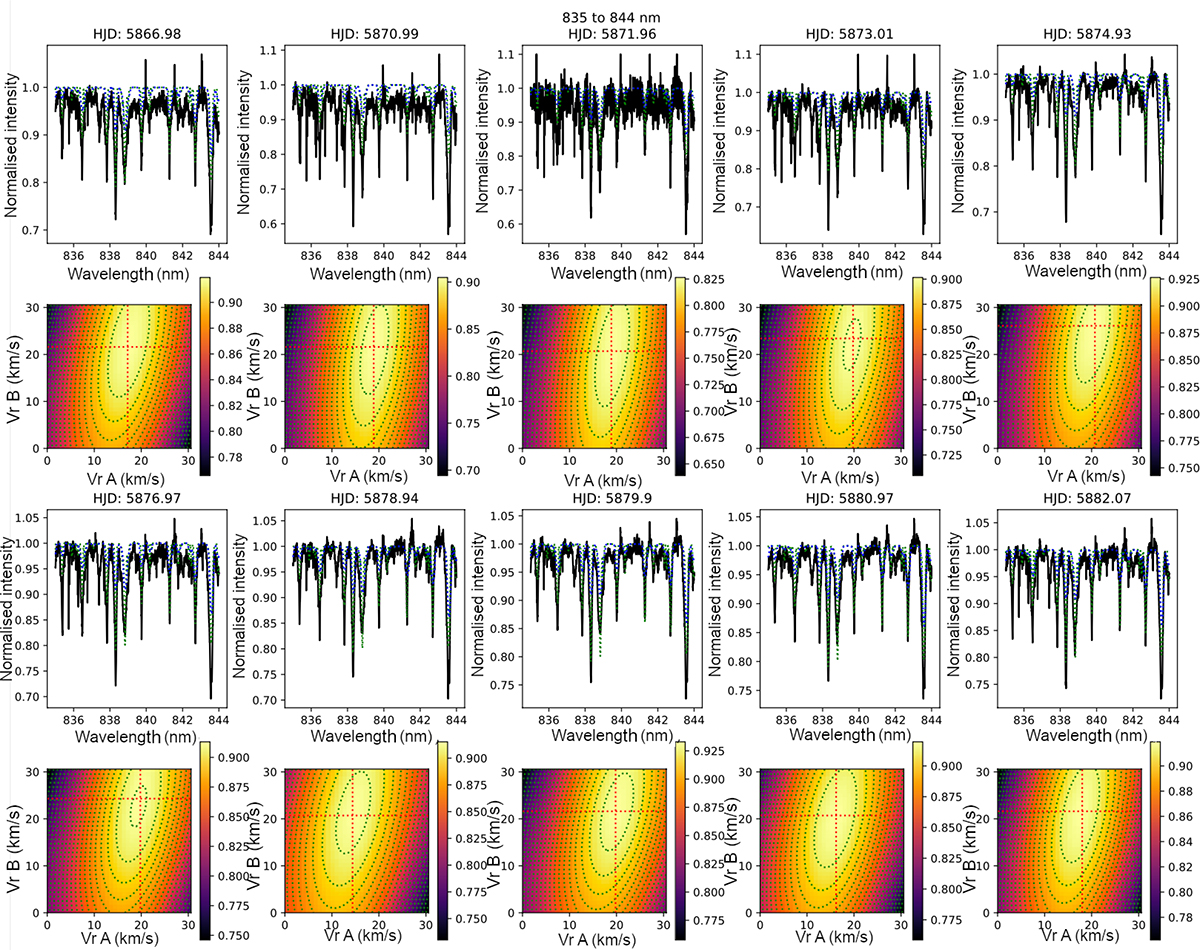
Cross-correlation results on the 835–844 nm wavelength window for the primary plus secondary model. First and third rows: Observed spectra (black), template for the primary (blue) and for the secondary (green), shifted to the obtained radial velocities. Second and fourth rows : 2D CCF obtained. The x- and y-axes represent the radial velocity of the primary and secondary, respectively. The colour scale is the Pearson correlation coefficient, the dotted green lines are the 2D Gaussian fit, and the red dotted line is the peak of the fitted Gaussian.
Current usage metrics show cumulative count of Article Views (full-text article views including HTML views, PDF and ePub downloads, according to the available data) and Abstracts Views on Vision4Press platform.
Data correspond to usage on the plateform after 2015. The current usage metrics is available 48-96 hours after online publication and is updated daily on week days.
Initial download of the metrics may take a while.