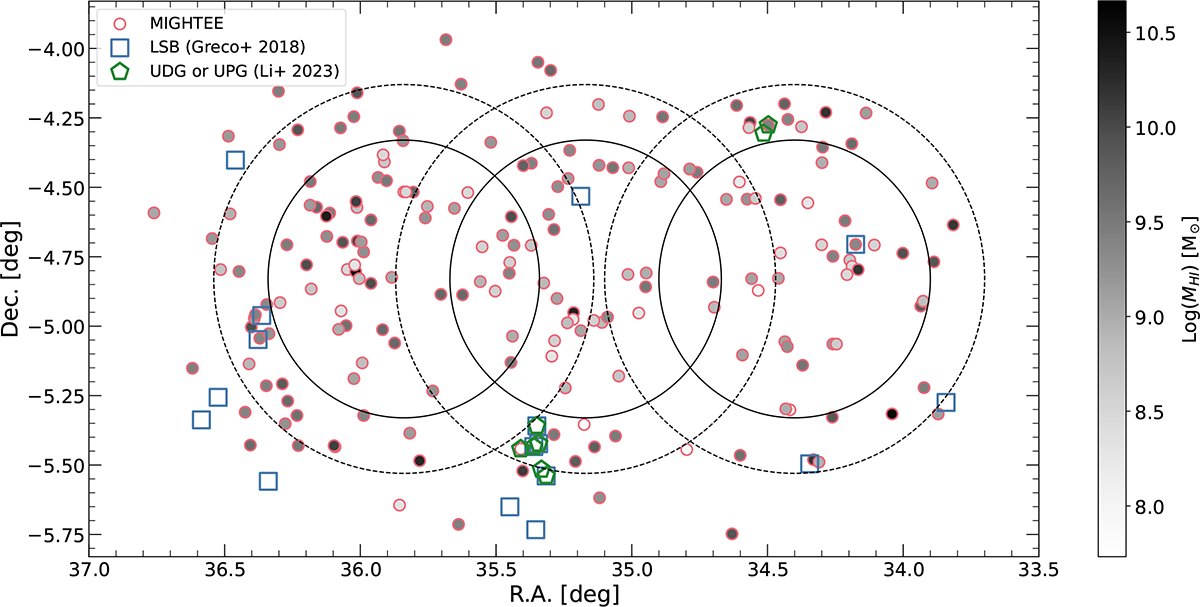
Fig. 1.
Download original image
Region of XMM-LSS covered in the MIGHTEE ES data. From left-to-right (decreasing right ascension), the three fields are XMM-LSS-14, XMM-LSS-13, and XMM-LSS-12. The solid lines indicate the full width half maximum of the MeerKAT primary beam, and the dashed lines represent the 30% response level. The MIGHTEE H I detections are shown as circles, shaded based on their H I mass. Also included are the LSBGs of G18 (blue squares) and the UDGs and UPGs of L23 (green pentagons) that fall within the considered footprint.
Current usage metrics show cumulative count of Article Views (full-text article views including HTML views, PDF and ePub downloads, according to the available data) and Abstracts Views on Vision4Press platform.
Data correspond to usage on the plateform after 2015. The current usage metrics is available 48-96 hours after online publication and is updated daily on week days.
Initial download of the metrics may take a while.