Fig. 5.
Download original image
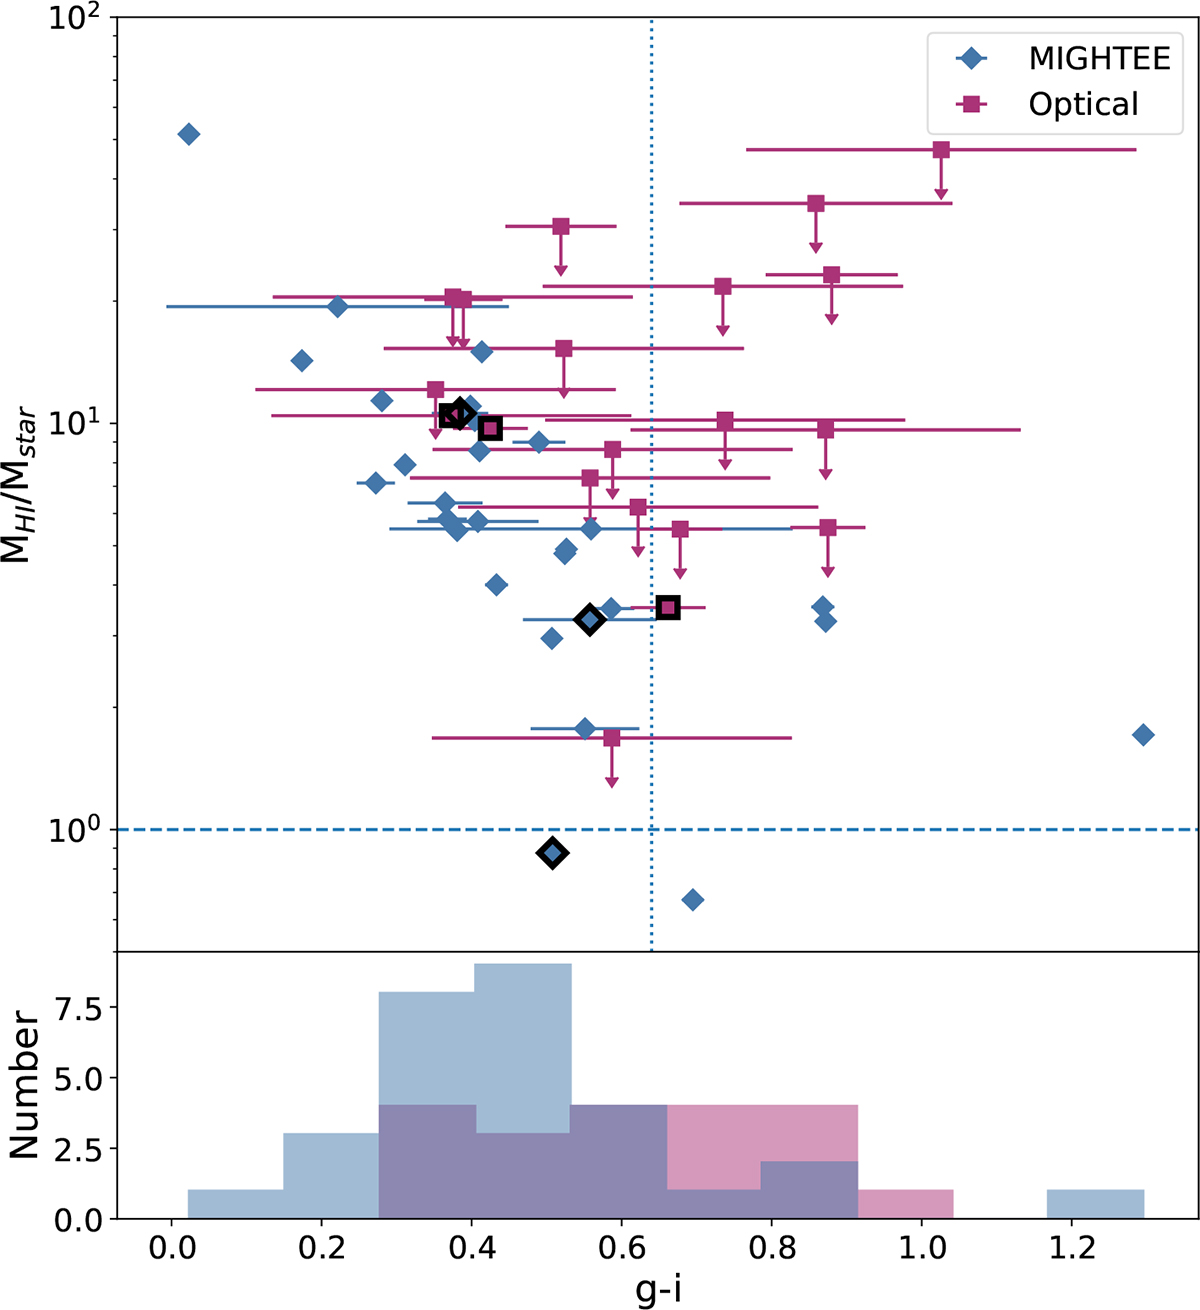
Colors of the optically and H I-selected galaxies. Upper:g − i color vs. MHI/M*. Downward arrows indicate upper limits. Symbols highlighted in black indicate the cross-matched galaxies that are plotted twice. The vertical dotted line at 0.64 indicates the cut between “red” and “blue” used in G18. The dashed horizontal line indicates a MHI/M* value of one. Lower: Histogram of the color distribution of both the MIGHTEE-detected (blue) and optically detected galaxies (pink).
Current usage metrics show cumulative count of Article Views (full-text article views including HTML views, PDF and ePub downloads, according to the available data) and Abstracts Views on Vision4Press platform.
Data correspond to usage on the plateform after 2015. The current usage metrics is available 48-96 hours after online publication and is updated daily on week days.
Initial download of the metrics may take a while.