Open Access
Fig. 3.
Download original image
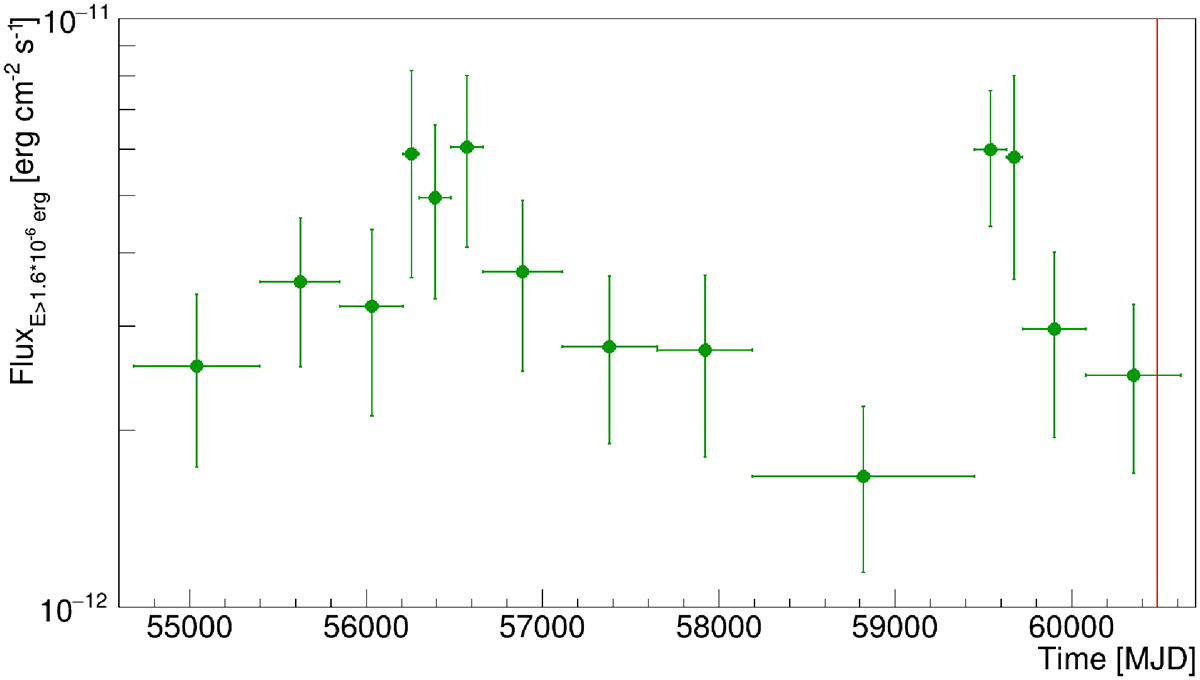
γ-ray (E> 100 MeV) flux light curve of SBS 1343+537 during the full period of Fermi-LAT. The red line highlights the flare period. Each bin size was adjusted to ensure a minimum significance of TS ≥ 10.
Current usage metrics show cumulative count of Article Views (full-text article views including HTML views, PDF and ePub downloads, according to the available data) and Abstracts Views on Vision4Press platform.
Data correspond to usage on the plateform after 2015. The current usage metrics is available 48-96 hours after online publication and is updated daily on week days.
Initial download of the metrics may take a while.