Open Access
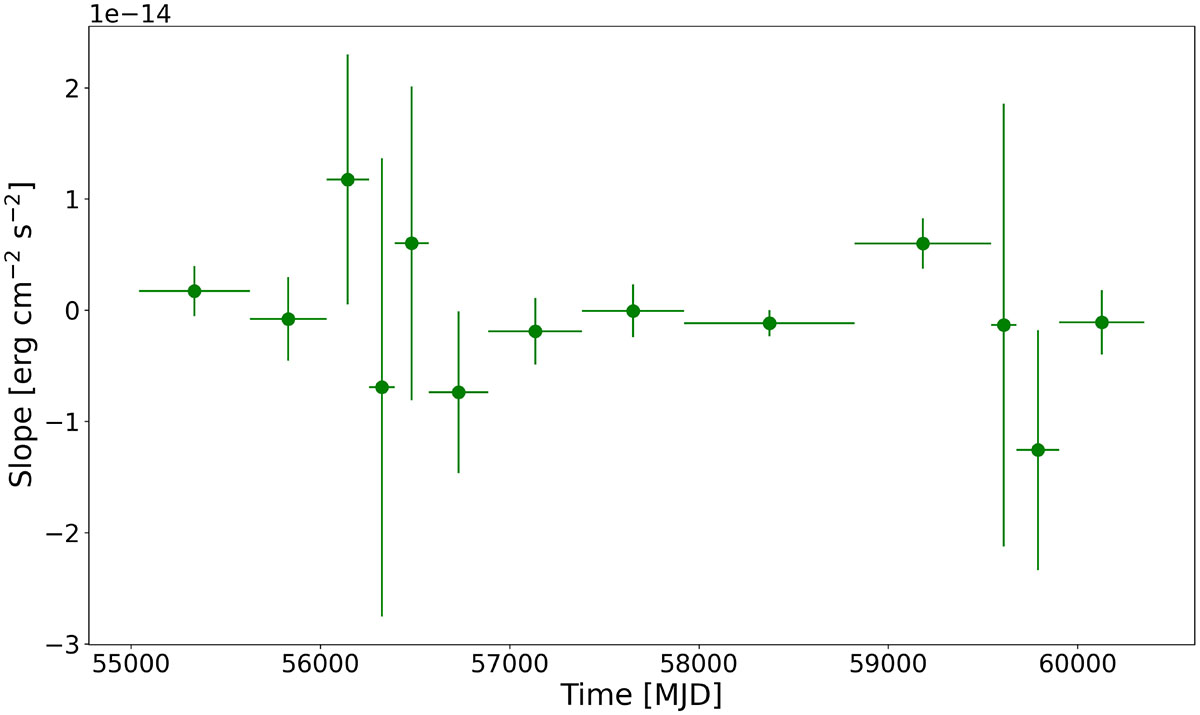
Fig. 4.
Download original image
Flux variability analysis of SBS 1343+537, showing rate of change of the γ-ray flux (slope) as a function of mid-time for each time interval. The plot illustrates variations in flux, with error bars representing the uncertainty in the slope and time.
Current usage metrics show cumulative count of Article Views (full-text article views including HTML views, PDF and ePub downloads, according to the available data) and Abstracts Views on Vision4Press platform.
Data correspond to usage on the plateform after 2015. The current usage metrics is available 48-96 hours after online publication and is updated daily on week days.
Initial download of the metrics may take a while.