Open Access
Fig. 7.
Download original image
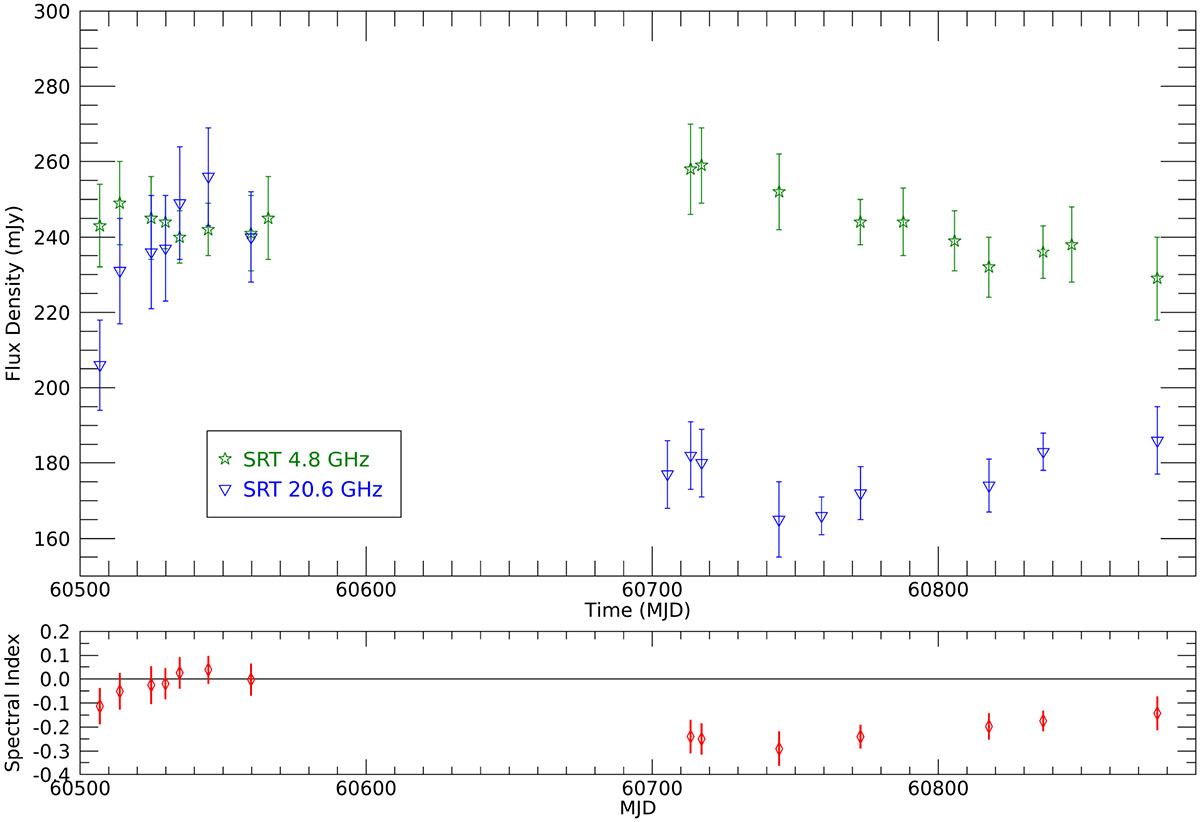
Upper panel: Radio light curve of SBS 1343+537 obtained at 4.8 GHz and 20.6 GHz with SRT, from July 15, 2024 (MJD 60506) to June 20, 2025 (MJD 60846). Lower panel: Evolution of the spectral index α of SBS 1343+537.
Current usage metrics show cumulative count of Article Views (full-text article views including HTML views, PDF and ePub downloads, according to the available data) and Abstracts Views on Vision4Press platform.
Data correspond to usage on the plateform after 2015. The current usage metrics is available 48-96 hours after online publication and is updated daily on week days.
Initial download of the metrics may take a while.