Open Access
Fig. 2.
Download original image
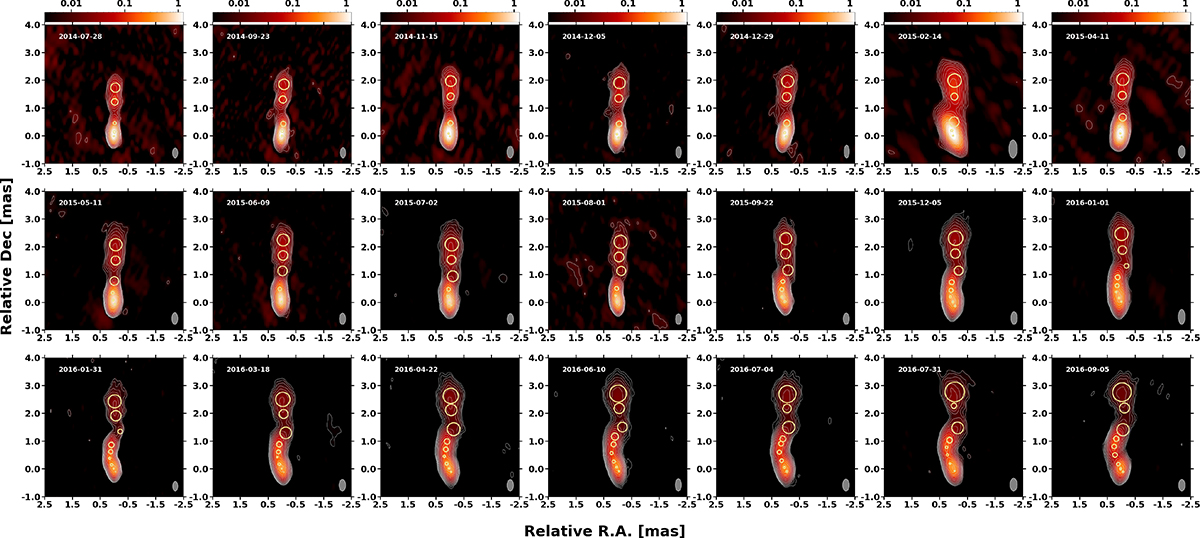
CLEAN maps at VLBA 43 GHz from July 2014 to September 2016. The contour starts from three times the RMS noise level and increases by a scale factor of 1.4. The yellow circles indicate the sizes (FWHM) of the individual components at each observation. The gray ellipses indicate the synthesized beam sizes for each epoch.
Current usage metrics show cumulative count of Article Views (full-text article views including HTML views, PDF and ePub downloads, according to the available data) and Abstracts Views on Vision4Press platform.
Data correspond to usage on the plateform after 2015. The current usage metrics is available 48-96 hours after online publication and is updated daily on week days.
Initial download of the metrics may take a while.